
You’ve got data. You’ve got goals. But the moment someone says, “Can you put it into a dashboard?” — your head starts spinning. Suddenly, it’s not just about numbers, it’s about layouts, filters, KPIs, visual hierarchy… and somehow making the whole thing look polished enough that people can actually use it.
That’s where most teams get stuck. AI tools promise to save the day — “just drop your data in and voilà, instant dashboard”. And sure, they’re fast. A prompt can spin up a dashboard mockup in seconds. But we all know that speed doesn’t equal usability. More often than not, you end up with charts that look okay on the surface but leave users scratching their heads.
That’s why AI dashboard design is more than just letting a model draw charts. It’s about blending the efficiency of artificial intelligence with the clarity of good product design. And as AI becomes an essential part of modern SaaS products, understanding its impact on user experience is key — we explore this more deeply in our article on AI in SaaS.
In this guide, we’ll walk you through:
- The common reasons business dashboards fail (even when AI is involved).
- The best AI-powered tools for generating dashboards.
- A step-by-step workflow to turn raw AI output into usable dashboards.
- Real-world design inspiration (and mistakes to avoid).
- How design partners like Eleken help SaaS teams bridge the gap between AI and UX.
Because at the end of the day, dashboards should do more than exist. They should guide, inform, and help you make better decisions.
Why AI-generated dashboards fail
On paper, AI dashboards sound perfect. Just feed in your data, add a prompt, and out comes a ready-to-use dashboard. But if you’ve ever worked with one, you know it’s rarely that simple. Many teams discover that their new artificial intelligence dashboard looks impressive in demos but ends up ignored in practice. So, let’s have a look at seven of the most common pitfalls and why they happen.
- Data overload and cluttered layouts
One of the biggest issues is data overload. Product design AI tools love to give you everything at once — dozens of charts, endless KPIs, rows of numbers. So instead of surfacing key insights, the dashboard AI buries them in noise. Users often face analysis paralysis and waste time hunting for meaning in a cluttered interface. But a well-designed AI dashboard should focus on clarity, not volume.
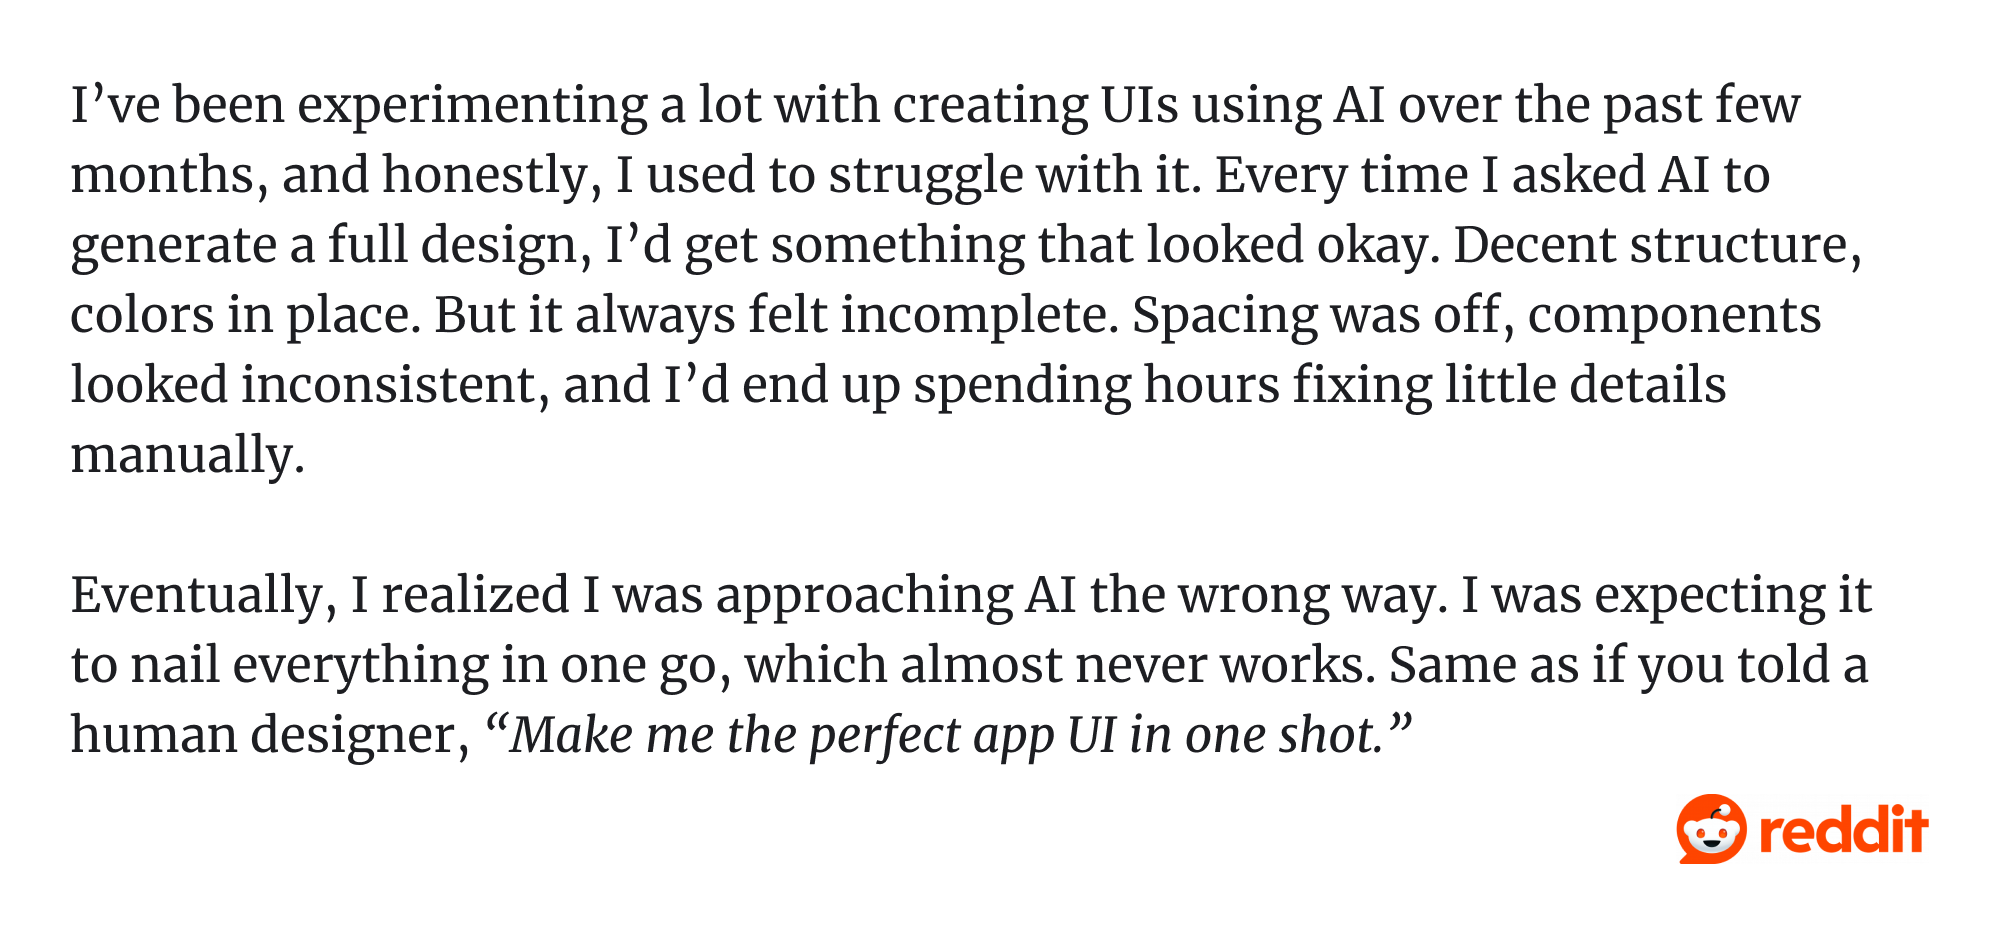
We see many discussions on this topic on Reddit, where designers share their mixed experiences with AI tools. As one user put it: "I've been experimenting a lot with creating UIs using AI over the past few months, and honestly, I used to struggle with it..."
- Missing context and explanation
Another common pitfall is context — or rather, the lack of it. It’s one thing for a dashboard to highlight churn risk; it’s another to explain why churn is happening or how the model reached that conclusion. Without that narrative, users quickly lose trust. So, for adoption to stick, dashboards need to show reasoning, provide context, and link insights to business goals.
- Poor visual hierarchy
AI can generate slick-looking visuals, but beauty alone doesn’t guarantee usability. When critical KPIs are buried under flashy charts or irrelevant graphics, the dashboard stops being useful. Without a clear visual hierarchy (consistent dashboard components, grouped metrics, highlighted numbers), dashboards confuse rather than guide.
- Static, non-interactive displays
A dashboard that only shows static snapshots is basically a report in disguise. But business questions don’t stop at the first layer — people need to drill down, filter, or play with the data. Without interactivity, users end up exporting everything to Excel, which defeats the whole purpose of having an AI-powered dashboard in the first place.
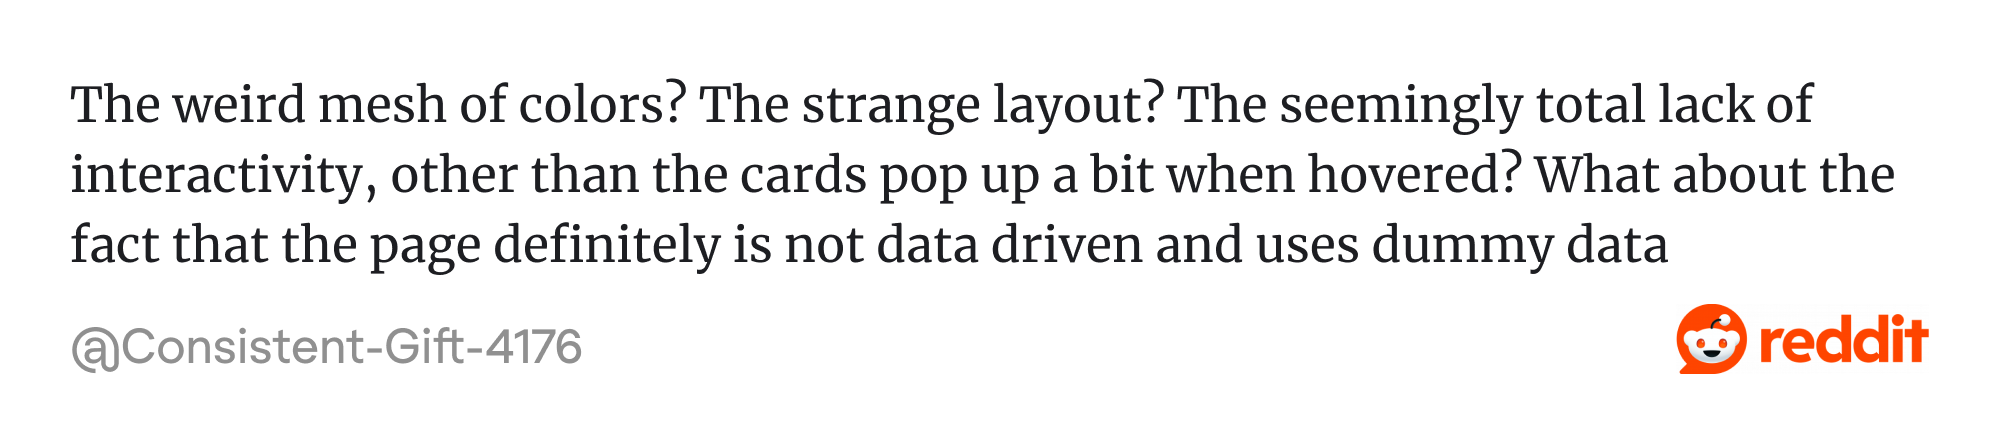
As one Redditor put it, “The weird mesh of colors? The strange layout? The seemingly total lack of interactivity, other than the cards pop up a bit when hovered? What about the fact that the page definitely is not data driven and uses dummy data.”
- Performance and navigation issues
Even the smartest AI insights don’t matter if the interface is slow or clunky. Long load times, non-responsive layouts, or menus hidden three clicks deep are deal-breakers. A dashboard must feel seamless and intuitive; otherwise, it won’t become part of anyone’s workflow.
- Misalignment with user goals
We also see dashboards designed for one group but handed to another. For example, leadership dashboards full of pipeline forecasts may look great in board meetings, but they don’t help sales reps on the ground. And if dashboards don’t align with real workflows and day-to-day needs, they simply go unused.
- Bad data, bad outcomes
Finally, there’s the classic “garbage in, garbage out” problem. If the data is outdated, incomplete, or inconsistent, even the most beautiful dashboard will crumble. Users spot inaccuracies quickly — and once they stop trusting the data, the dashboard’s value drops to zero.
At Eleken, we’ve seen all of these pitfalls up close. Many of our clients came to us with AI-generated dashboards that looked fine at first glance but weren’t usable. By applying design for personalization, we helped them cut through clutter, highlight what matters, and turn dashboards into powerful tools people can actually rely on.
Fast doesn’t have to mean ugly: the new AI dashboard stack
One of the biggest perks of AI in dashboard design is speed. With the right tools, you can go from raw data to a working dashboard in minutes — no endless setup, no heavy coding. But as we’ve already seen, speed without design can leave you with dashboards that are technically “done” but practically unusable.
That’s why it helps to think of today’s AI dashboard tools as a stack. Different tools serve different needs — some are great at generating layouts instantly, while others focus on deeper insights or flexible design. And instead of overwhelming you with dozens of options, we’ll break things down into clear categories so you can see which tool type makes sense for your team.
Prompt-based generators
Let’s start with the simplest category: prompt-based generators. These tools let you describe what you want in plain language — “show me churn by plan”, “visualize revenue growth by cohort” — and they’ll build a dashboard for you in seconds. They’re quick, accessible, and a good way to test ideas without a big learning curve. So here are a few worth checking out.
Onvo AI
Onvo is one of those AI dashboard tools built for speed. Connect your data, type in what you want to see, and it spins up a working dashboard in no time. For startups or SaaS teams that don’t want to spend weeks setting up BI tools, that’s a big win.

Of course, speed has its limits. The dashboards you get are functional, but not deeply customized. Layouts can feel a bit generic, and without design polish, they may not be ready for end-users right out of the box.
The upside is speed and cost-effectiveness (plans start at around $99/month). The trade-off? Onvo works best for small to mid-sized teams, so it may not cover very advanced or enterprise-scale use cases yet.
Still, Onvo is a solid way to get moving fast. It’s especially handy if you want to validate which metrics matter most before investing in something more advanced — or before bringing in design help to make those dashboards shine.
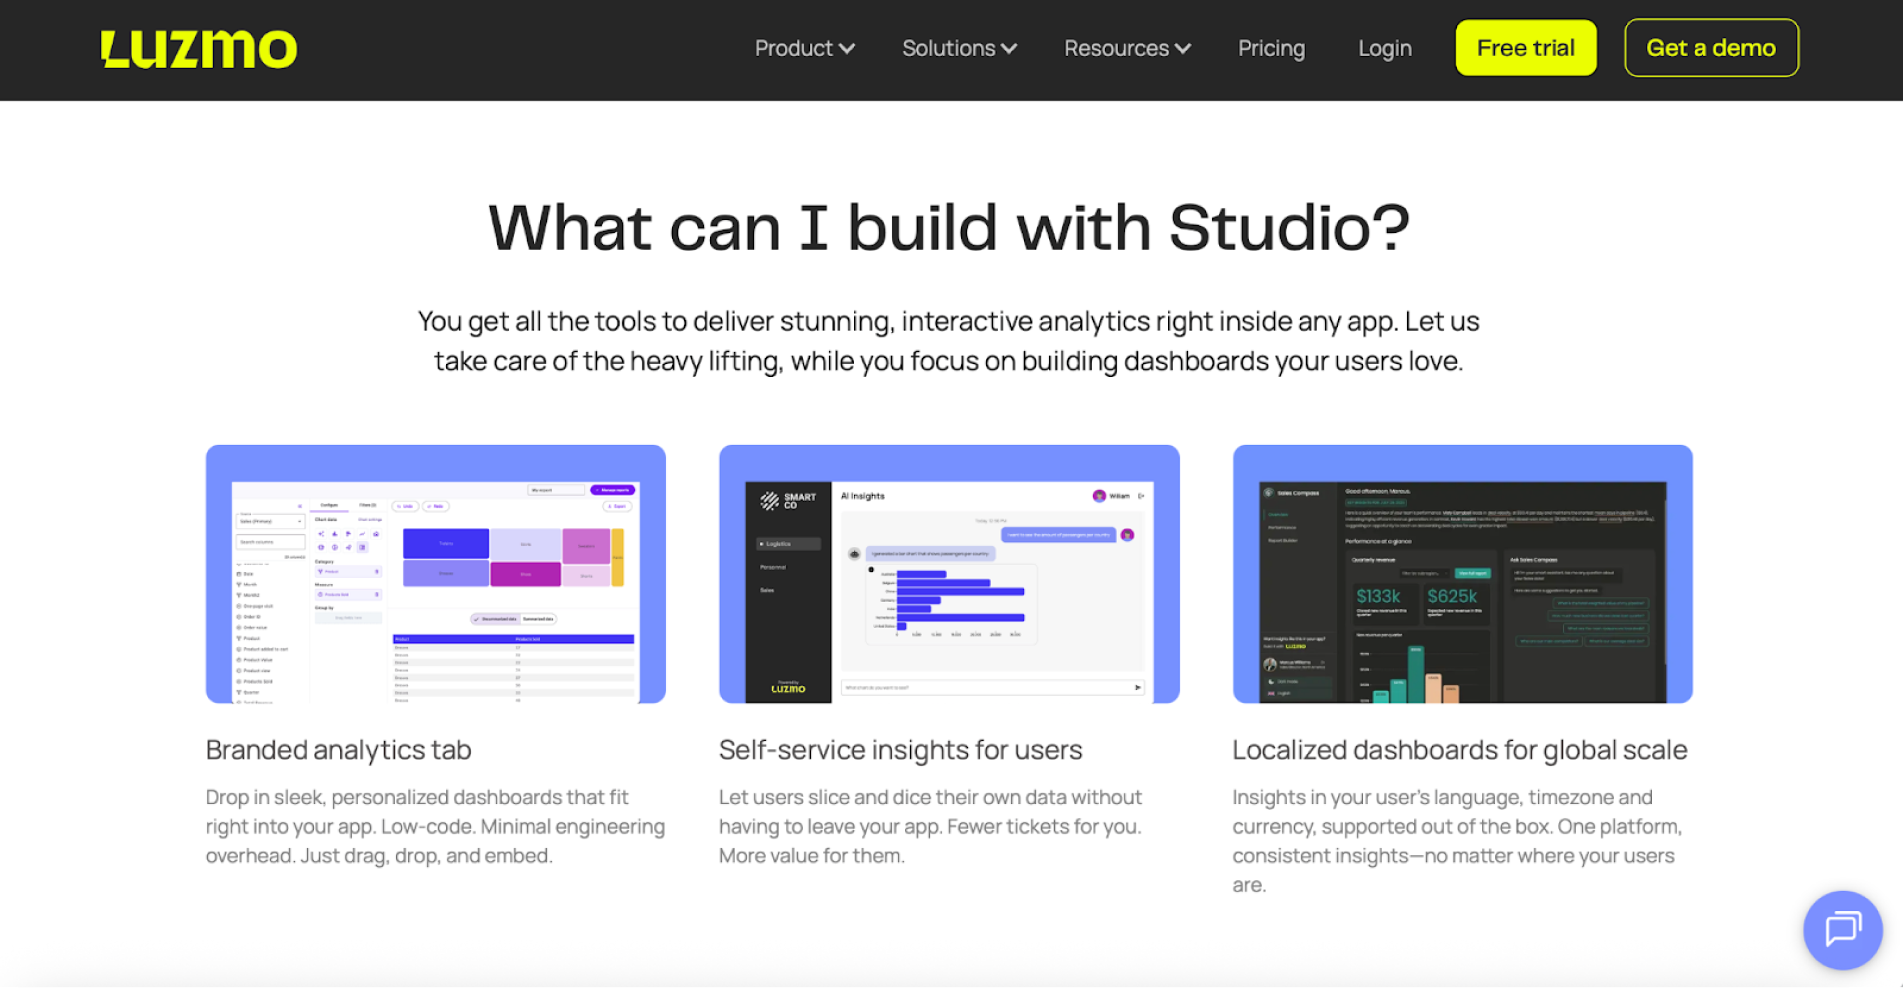
Luzmo
Luzmo positions itself as more than just a dashboard generator — it’s an embedded analytics platform built for SaaS teams who want dashboards inside their product. With features like Luzmo IQ (ask questions in natural language) and an AI chart generator, it makes it easier for non-technical users to turn raw data into visual insights.
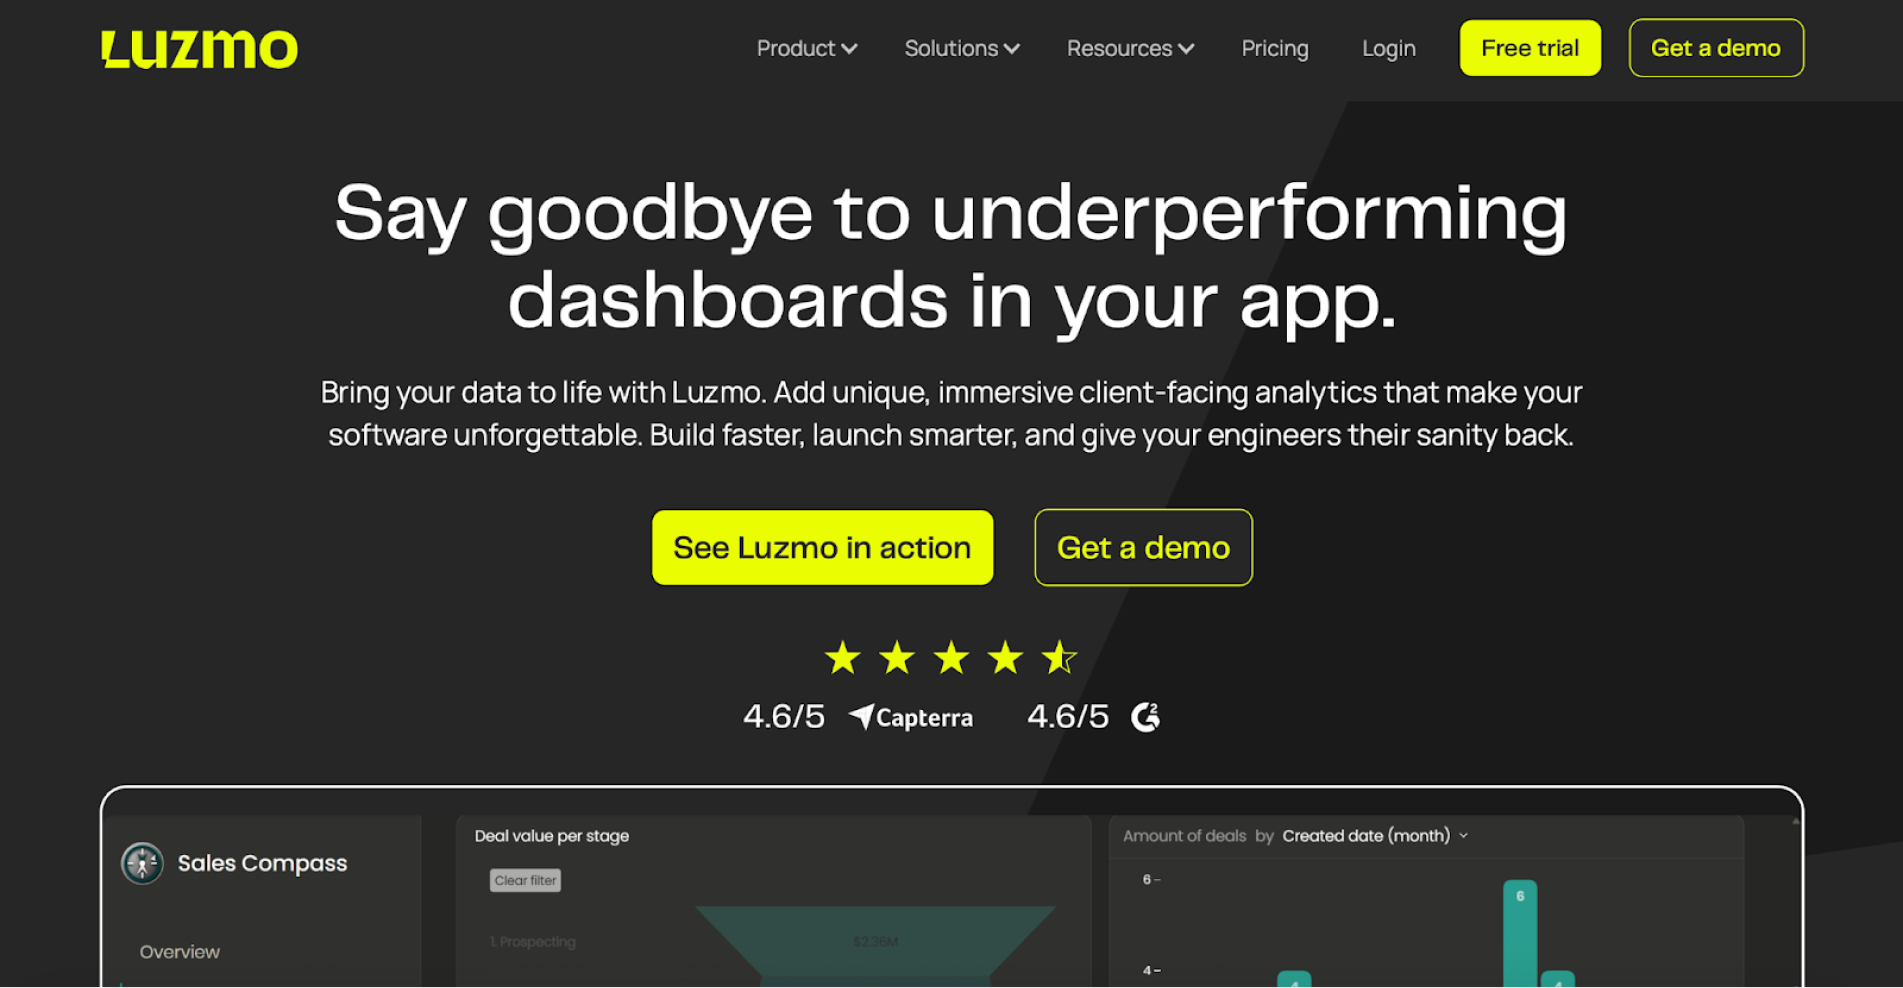
The strength of Luzmo is flexibility. It’s API-first, white-label friendly, and designed so your users can even tweak dashboards themselves through an embedded editor. That makes it appealing if you’re building a SaaS product and want analytics to feel like a native part of your app rather than an external tool.
On the flip side, embedding still requires engineering work, and the quality of insights depends on how clean your data is. Some advanced features sit behind higher-tier plans, and the AI isn’t always perfect with “why” or predictive questions. Still, for many product teams, Luzmo is a powerful way to deliver AI-augmented dashboards without reinventing the wheel.
Notion AI dashboards
Notion itself is a flexible and very well-known “all-in-one workspace”. With the advent of Notion AI, you can turn databases and pages into simple dashboards that summarize tasks, track KPIs, or surface quick insights. Think of it less as heavy analytics and more as a flexible way to centralize work and metrics in one place.

The upside is accessibility. Building dashboards in Notion feels familiar if you already use it — drag-and-drop, templates, database views, plus AI that can summarize or answer questions about your data. It’s ideal for teams that want lightweight dashboards alongside docs, tasks, and knowledge management, without jumping into another tool.
However, Notion AI dashboards aren’t a substitute for real BI. Advanced charts, drill-downs, and real-time analytics often require external integrations, and the AI can stumble on complex database queries. For small teams, though, it’s a convenient way to keep everything — projects, docs, and data — in one place.
Data-insight copilots
Once you move beyond simple dashboard generators, the next level is AI copilots — tools that don’t just visualize your data, but help you think with it.
So, what exactly are data-insight copilots? In simple terms, they’re AI assistants that help you explore data and uncover meaningful insights using natural language. They combine large language models (like GPT-5) with your existing data tools, which means you can ask questions such as “Why did revenue dip last month?” or “Show me user growth by region” — and the copilot does the heavy lifting for you.
These copilots fetch data, run the analysis, and even create interactive visualizations — all without you needing to write SQL queries or code. They remove the manual friction of traditional analytics so you can focus on interpreting results and making decisions.
Below, we’ll walk through a few popular setups worth exploring.
GPT + Retool
Retool is a platform for building custom internal tools and dashboards quickly, often used by companies to make internal apps without from-scratch coding. Instead of clicking through endless filters or writing SQL queries, users can simply ask the dashboard questions in plain language. Retool translates those prompts into database queries, runs them, and shows the results directly in charts or tables.
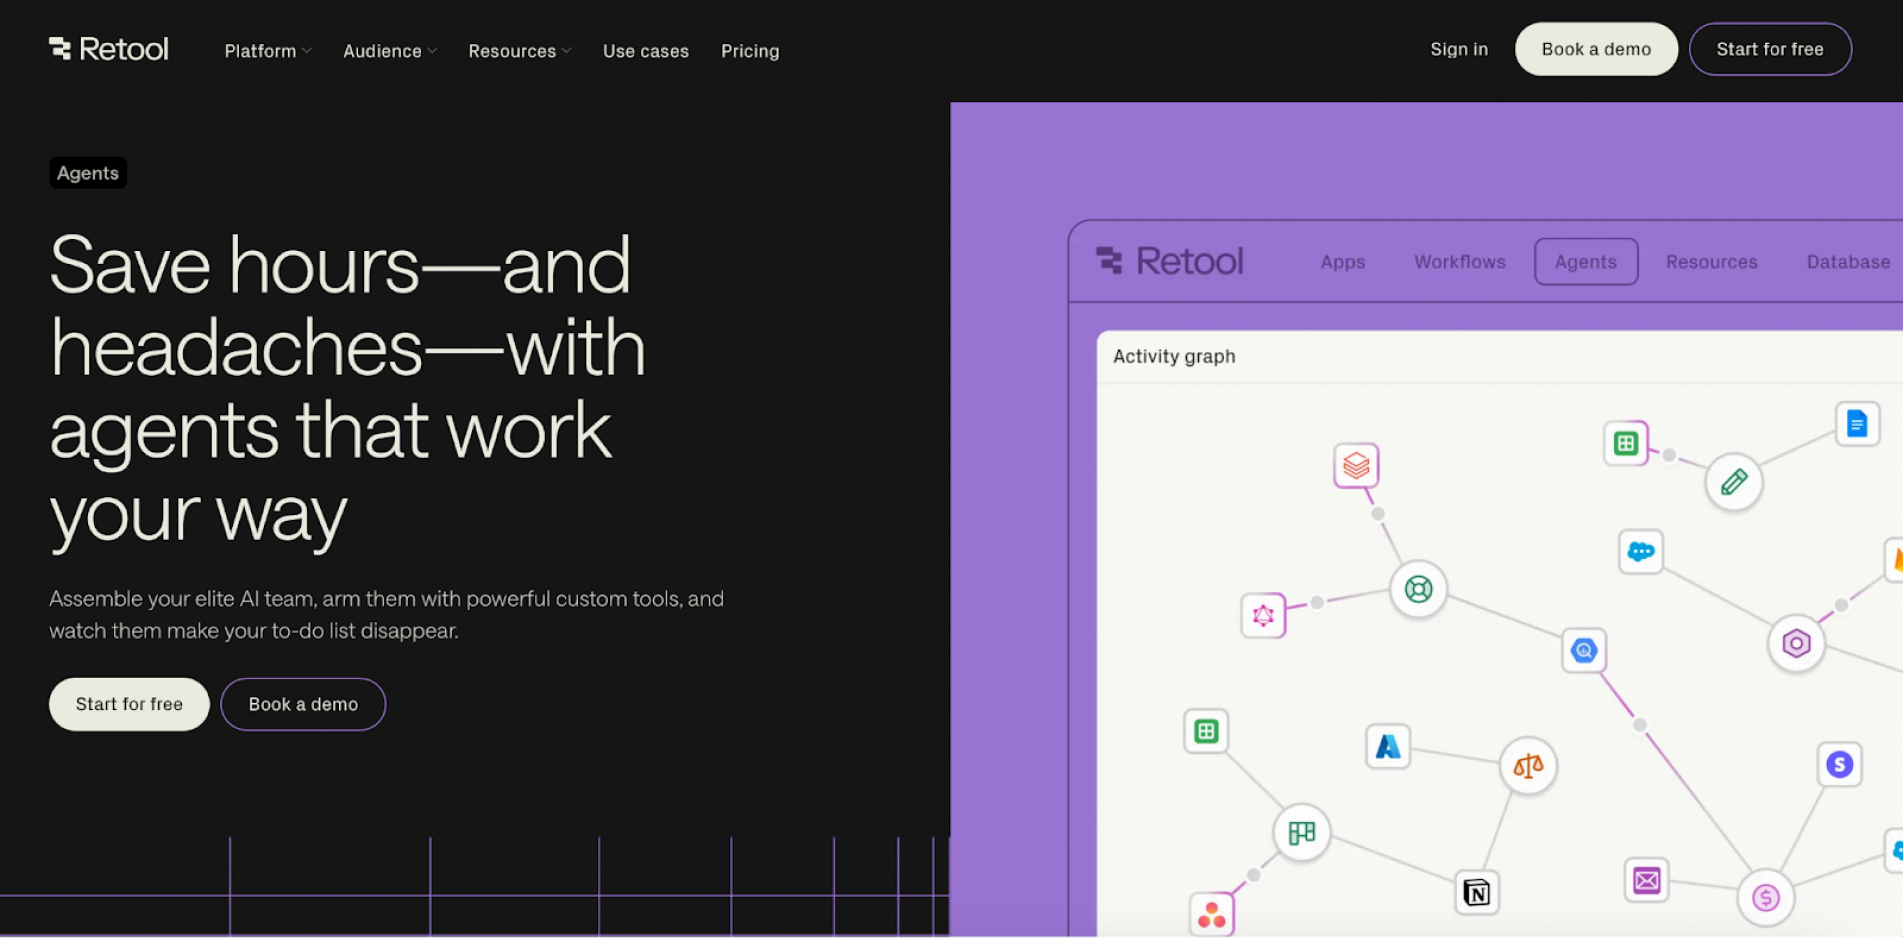
In practice, it means your internal dashboard can act like a data assistant. A sales manager might ask, “Show total revenue by region this quarter”, or a support rep could type, “Find the last order from customer Jane Doe”, and the AI instantly pulls that data from connected systems.
The biggest advantage is control. The AI runs inside your Retool environment, so company data stays secure, permissions are respected, and teams can customize what the copilot can do. The only catch? It takes some setup — you’ll need someone technical enough to connect the APIs and define the AI’s scope. But once it’s running, GPT + Retool can save hours of manual digging by turning internal dashboards into conversational data copilots.
ChatGPT + CSV
If the idea of setting up tools or writing code sounds intimidating, ChatGPT + CSV is as simple as it gets. You upload a spreadsheet — say, a sales report or campaign tracker — and then just talk to your data. ChatGPT’s Advanced Data Analysis feature (formerly known as Code Interpreter) lets you ask questions like “Which product brought in the most revenue last quarter?” or “Can you plot monthly spend vs. ROI?” and it handles all the analysis behind the scenes.

Under the hood, ChatGPT writes Python code, runs calculations, and even generates charts — but you don’t have to see any of it unless you’re curious. Basically, it’s like having a data analyst on demand: you upload a file, ask questions, and instantly get answers, summaries, or visuals right in the chat window.
However, this approach comes with downsides as well. Your data is processed through OpenAI’s servers, so it’s best for non-confidential datasets. It’s also more of an ad-hoc analysis tool than a dashboard builder — you won’t get a shareable interface, but you will get quick, flexible insights without setup or training. For solo users or small teams, it’s the easiest way to turn a plain CSV into actionable insights in minutes.
Power BI + Copilot
For companies that already use Microsoft’s ecosystem, Power BI + Copilot is where AI-driven dashboards go pro. Copilot is Microsoft’s built-in AI assistant (powered by GPT-4 through Azure OpenAI) that lives directly inside Power BI. It allows users to chat with their data, asking questions like “Which region grew fastest this quarter?”, and get immediate answers or even auto-generated visuals right on the report canvas.

For analysts and business users, this means less manual filtering and more focus on interpretation. For report builders, Copilot speeds up the creation process by generating visuals, writing DAX formulas, and even suggesting report layouts from a simple prompt. It’s a genuine productivity boost that helps teams build and refine dashboards without starting from scratch.
Because it runs entirely within Microsoft’s secure environment, data stays governed by the same permissions and compliance policies already in place. The setup does require enterprise licensing and some configuration, but once enabled, Copilot turns Power BI into a conversational, AI-assisted analytics hub — powerful enough for large organizations, yet intuitive enough that anyone can start exploring data without deep technical skills.
Design-friendly tools
If the previous tools focused on data generation and analysis, this next group is all about how dashboards look and feel. Design-friendly tools like Bubble, Framer, and Figma AI plugins lower the barrier for creating AI-powered dashboards by letting you build visually, no deep programming required. They’re built for teams that care as much about usability and aesthetics as they do about functionality.
What makes them “design-friendly” is their flexibility. These platforms let you go from idea to interactive prototype quickly, tweaking layouts and styles on the fly. Each one plays a different role in the product cycle: Figma helps shape early design concepts, Framer turns designs into live interactive experiences, and Bubble builds full working apps with databases, logic, and AI integrations — all without touching code.
In the context of AI dashboards, this means you can focus on crafting a great user experience while the tool handles the heavy technical lifting behind the scenes.
Bubble
Let’s start with Bubble. Bubble is a visual, no-code platform for building full web applications, not just a dashboard prototype. You design everything through a drag-and-drop interface, which means you can create complex dashboards and workflows without writing a single line of code. That makes it especially appealing to designers, product teams, or data professionals who want control over layout and functionality without depending on developers.
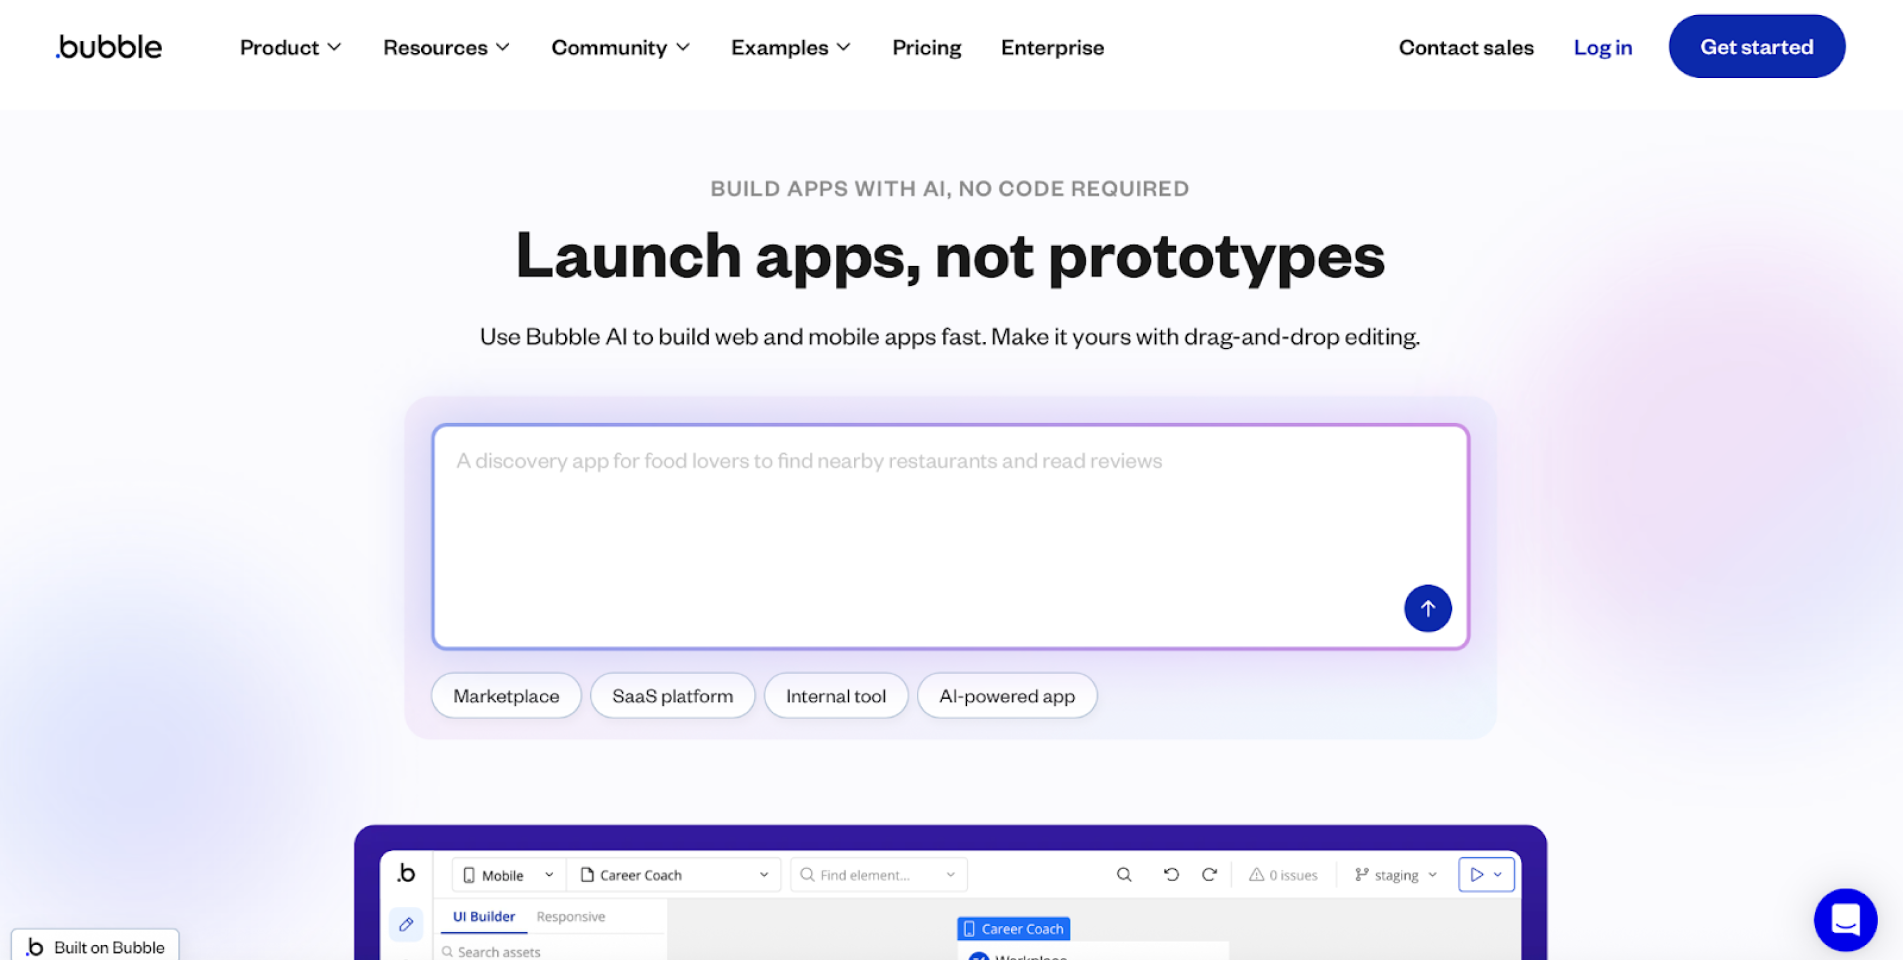
For AI dashboards, Bubble really shines through its integrations. You can connect APIs or use plugins to add features like predictive analytics, chatbot assistants, or AI-generated insights. For example, connecting Bubble to OpenAI’s API lets you build dashboards that automatically summarize reports or forecast trends, all through its visual editor.
In short, Bubble bridges design and data. It gives you the creative freedom to shape how your dashboard looks while letting you plug in powerful AI features. If you want to build an AI-powered dashboard that feels like a complete app and not just a static report, Bubble is one of the most flexible no-code options out there.
Framer + GPT
Framer sits somewhere between a design tool and a development platform. It lets you visually design interactive websites and dashboards while generating clean React code in the background. You get the creative freedom of a design canvas, but the results are production-ready — no messy handoffs or template limitations. That’s what makes Framer a favorite among designers who want flexibility and polish without diving deep into code.

Adding GPT-powered features takes Framer a step further. Its AI assistant, Wireframer, lets you describe what you want — for example, “create a dashboard with three KPI cards and a chart section” — and Framer instantly generates a responsive layout with starter content. You can then refine it visually, add animations, and even embed GPT integrations to handle tasks like generating text, answering questions, or creating dynamic content directly inside the dashboard.
With Framer + GPT, teams can prototype and launch AI-driven dashboards that look custom-built — complete with chatbots, smart summaries, or other interactive AI features — all without needing a full development cycle.
Figma + AI plugins
Figma has long been the go-to tool for UI/UX designers, and its growing lineup of AI plugins makes the design process even faster. These plugins act like intelligent assistants inside your design canvas — generating wireframes, suggesting content, and automating tedious tasks. Instead of starting from a blank screen, you can type a prompt like “create a dashboard for tracking monthly revenue and expenses”, and an AI wireframe generator will sketch the layout for you in seconds.
For dashboard projects, tools like Magician (by Diagram, now part of Figma) can generate icons, suggest interface copy, rename layers, or even create illustrations that fit your theme. Combined with Figma’s own AI features — such as replacing placeholder text with contextually relevant content — designers can prototype realistic dashboards faster than ever.
In short, Figma’s AI plugins turn design from a manual grind into a collaborative flow between human creativity and machine assistance. You still control the look and feel, but the AI handles the filler work, so you can focus on crafting dashboards that not only look beautiful but also feel smart and purposeful.
Customizable SDKs
Okay, don’t freak out when you see the term SDK — we know, it sounds like something only hardcore developers talk about, but stick with us as it’s actually simpler than it seems. SDK stands for Software Development Kit, which is basically a set of ready-made tools, libraries, and APIs that help you build faster without starting from zero.
In the world of AI dashboards, SDKs give you both structure and freedom. They let your team embed dashboards, tweak layouts, control how data flows, and even react to user actions — all while adding AI-driven features like smart summaries or natural-language insights. In short, SDKs strike a balance between flexibility and convenience: you get to design the experience your way, but with fewer technical headaches.
Luzmo SDK
As we mentioned earlier, Luzmo is known for making embedded analytics simple for SaaS and product teams. But if you want to go beyond pre-built dashboards and actually shape how analytics live inside your product, Luzmo’s SDK is the right place to look.
The Luzmo SDK gives developers the power to embed dashboards directly into your app using familiar frameworks like React, Vue, or Angular. You can manage everything — datasets, dashboards, user permissions — through their API, and style the whole thing so it looks native to your product. Think of it as a design-friendly analytics engine that you can bend to your brand.
And what actually makes Luzmo stand out is how it blends customization with AI. With Luzmo IQ, you can weave in AI-powered summaries or natural-language insights, turning plain charts into smart, interactive dashboards. Your app can even “talk” to the embedded dashboard — syncing filters, triggering events, or pulling data dynamically.
For teams building AI dashboards, this balance is gold. You skip the pain of coding complex charting logic from scratch, but you still get deep control over the user experience. Of course, the trade-off is that you’re still tied to Luzmo’s ecosystem — if you need something wildly custom, you might bump into limits. But for most product teams, the payoff is clear: faster delivery, smarter dashboards, and a seamless user experience that feels 100% yours.
Apache Superset SDK
If you’d rather build your AI dashboards on open ground instead of a vendor’s fenced-in platform, Apache Superset is worth a look. It’s a popular open-source BI and visualization tool that lets teams explore data, build dashboards, and even embed those dashboards into other apps. Because it’s open source, you get full control — no licensing limits, no black boxes, and plenty of room to tinker.
Superset’s Embedded SDK (or embedding setup) allows you to integrate its dashboards directly into your own product. In practice, that means your users can interact with Superset dashboards inside your app without ever leaving it. You can handle authentication through your own system and even style the embedded views to match your brand. For many startups and enterprise teams, this creates the best of both worlds: the power of Superset’s visualization engine with the seamlessness of a built-in feature.
The real magic for AI dashboards comes from custom extensions. You can add your own chart types (for example, with Plotly) or connect it to AI models that generate predictions or summaries. In other words, your dashboard can show not just what happened, but what’s likely to happen next. Just keep in mind — this setup takes some technical work to manage things like embedding, authentication, and plugin maintenance.
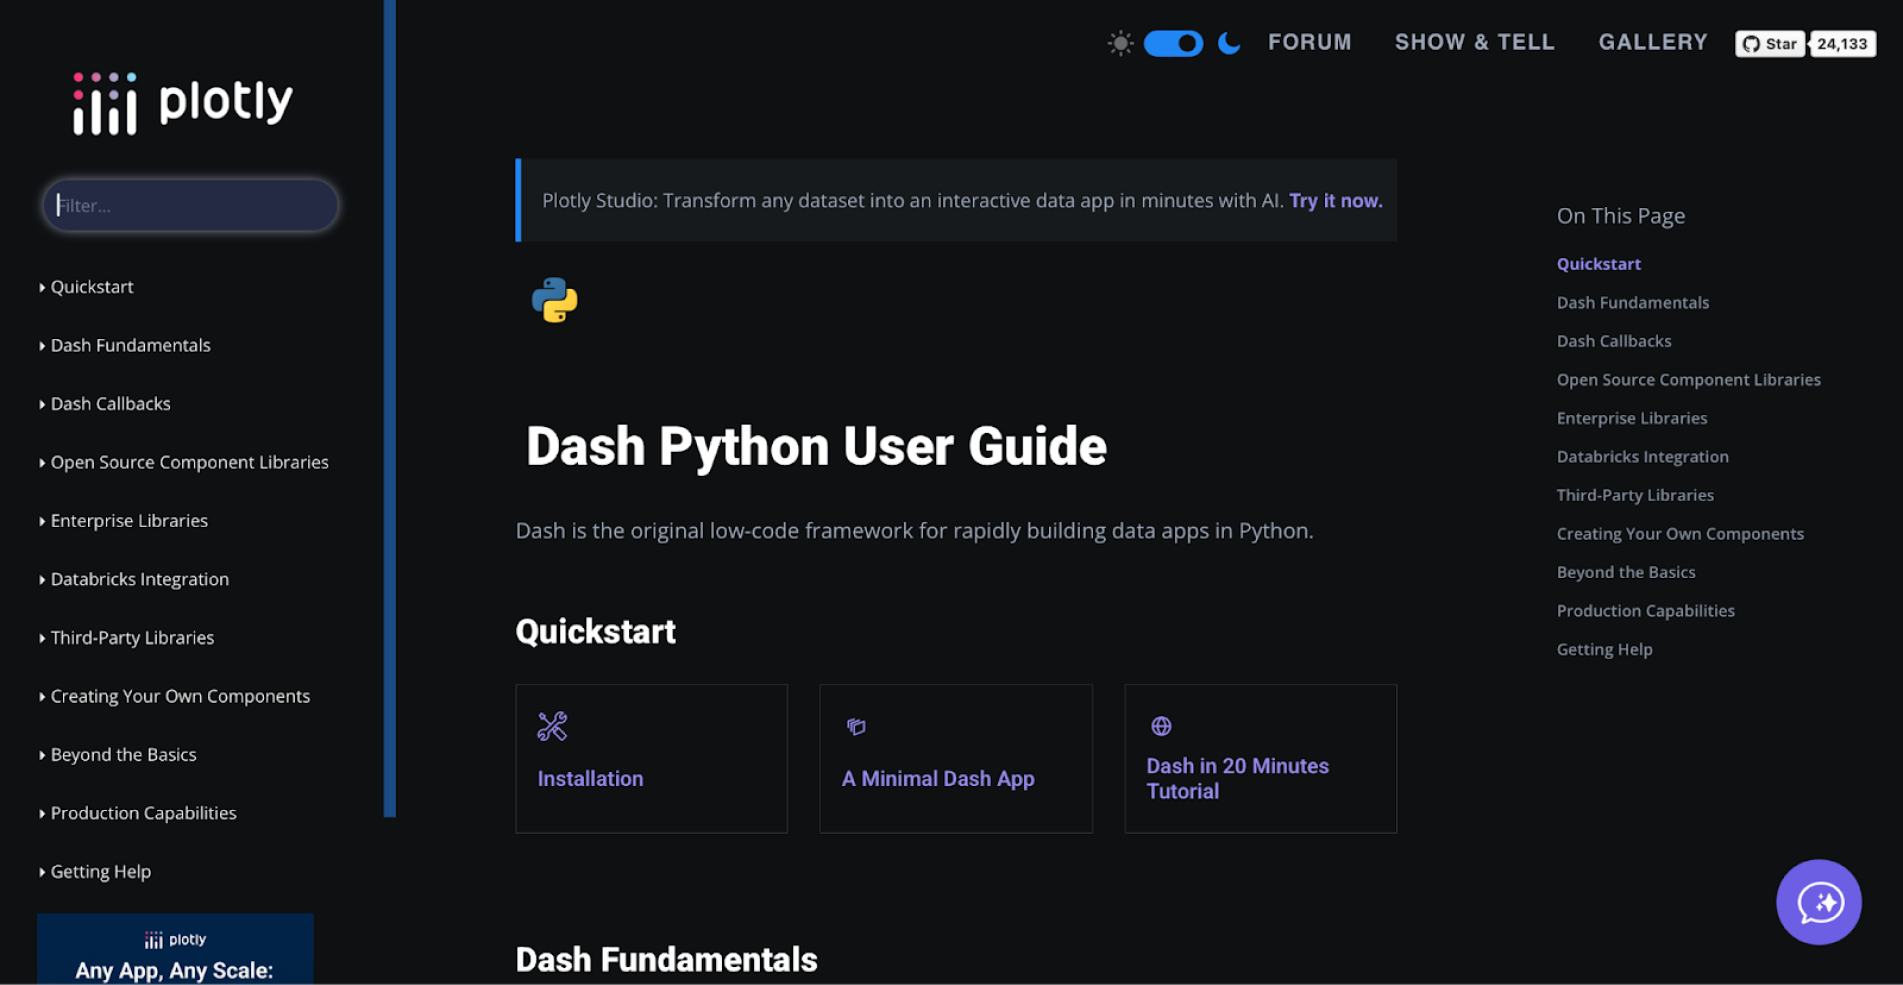
Dash by Plotly
If most dashboard tools are like drag-and-drop studios, Dash by Plotly is more like a developer’s workshop. It’s a Python-based framework for creating interactive web dashboards — meaning you write a bit of code, but you get total freedom over how your dashboard looks and behaves. Everything from layout to data logic is customizable.
Dash is especially powerful for AI-driven dashboards because it lets you connect directly to machine-learning models or AI APIs. For example, your dashboard could pull predictions from a model, show trend charts, or generate short written insights using GPT. Users can also interact with it — adjusting filters, changing inputs, or triggering live updates — and Dash instantly recalculates and refreshes the visuals.
Of course, that flexibility comes with a cost. You’ll need someone comfortable writing Python and managing deployment. Dash isn’t the easiest path, but it gives teams full creative and technical control — ideal for advanced, highly interactive dashboards that go far beyond templates.
So, that was a lot indeed. We’ve covered everything from plug-and-play embedding kits to full-control frameworks. And yes, some of these tools can feel intimidating at first (especially if “SDK” still sounds like a secret code). But don’t worry, you don’t need to master them all. The point is to understand what’s out there, explore what fits your workflow, and pick the level of control that feels right for you.
Workflow: how to go from prompt to polished dashboard (with or without a designer)
After exploring all the tools, SDKs, and AI features, it’s time to get a bit more practical. Let’s talk about how to actually bring your AI dashboard design to life — from your first concept sketch to something people can click, explore, and rely on.
This section walks you through the step-by-step workflow that most teams follow when designing and building an AI-powered dashboard. Whether you’re using prompt-based generators, SDKs, or design-friendly tools, the overall process stays surprisingly consistent. The goal here isn’t to overwhelm you with technical detail, but to give you a clear, structured path — one that helps you move from “we should build a dashboard” to “wow, this actually works”.
And before diving into sketches or mockups, it’s smart to revisit best practices in dashboard design, so you can check out our guide on how to design a dashboard for extra depth.
Step 1 – Generate the rough structure with AI
Start by getting something on the screen. Choose your AI dashboard tool (like Onvo, Retool, or ChatGPT + CSV) and feed it a clear, focused prompt that defines what you want to see. For example:
“Create a dashboard that shows revenue by region, churn by plan, and three health KPIs for the last quarter.”

This is a quick mockup dashboard generated with ChatGPT, based on a fictional SaaS company called FlowMetrics. It visualizes revenue by region, churn by plan, and three key health KPIs (Monthly Active Users, Customer Acquisition Cost, and Net Promoter Score) for the last quarter.
At this stage, don’t worry about color palettes or chart perfection — your goal is to create a skeleton that includes the right data points, components, and page flow. Treat your layout as a dashboard mockup, not a final product. Once you have this structure, you can start evaluating what works and what doesn’t.
Step 2 – Review and refine (AI self-critique)
Once you’ve generated a rough structure, the next step is to refine it — and this is where AI in UX design can act as your design critic. So, think of it as getting a second opinion before you dive into polishing.
Many modern AI systems (like ChatGPT with vision capabilities, or specialized design assistants) can analyze dashboard descriptions, screenshots, or layout mockups to identify weak spots in usability. You can ask targeted questions such as:
“Examine this dashboard layout. Is the spacing consistent? Are related elements grouped logically? Do the most important metrics stand out visually?”
A good AI “design reviewer” will flag concrete issues — like uneven spacing, inconsistent fonts, crowded sections, or weak visual hierarchy. For example, it might tell you that your KPI cards are too close together, or that your key revenue metric blends in rather than standing out.
Step 3 — Apply UX best practices (the human touch)
Now that the AI has critiqued your layout and flagged technical inconsistencies, it’s time for a human review. This is the stage where your UX designer — or whoever on your team has a sharp design eye — steps in to bring real usability and polish. AI can highlight spacing issues, but only people can judge how it feels to navigate the dashboard. The goal here is to turn something functional into something truly usable and intuitive.
And before diving into visual tweaks, it’s smart to evaluate your design for friction points that could confuse users. This practical guide on how to find and fix UX issues early walks through proven methods for catching problems before launch.
So, here are few things to keep in mind:
1. Clear labeling
Every element on the dashboard should explain itself. That means titles, axis names, and KPI labels that are short, clear, and specific. Replace vague names like “Performance Overview” with something meaningful like “Monthly Active Users (Last 90 Days)”. Avoid jargon and abbreviations that only insiders understand, as you want any stakeholder to instantly grasp what they’re seeing.
Good labeling reduces cognitive load. Users shouldn’t have to hover over charts or read tooltips just to understand what’s being shown. A clear title or metric name should make the chart’s purpose self-evident at first glance. As UX experts like to say: “If users have to think about what a label means, it’s not clear enough”.
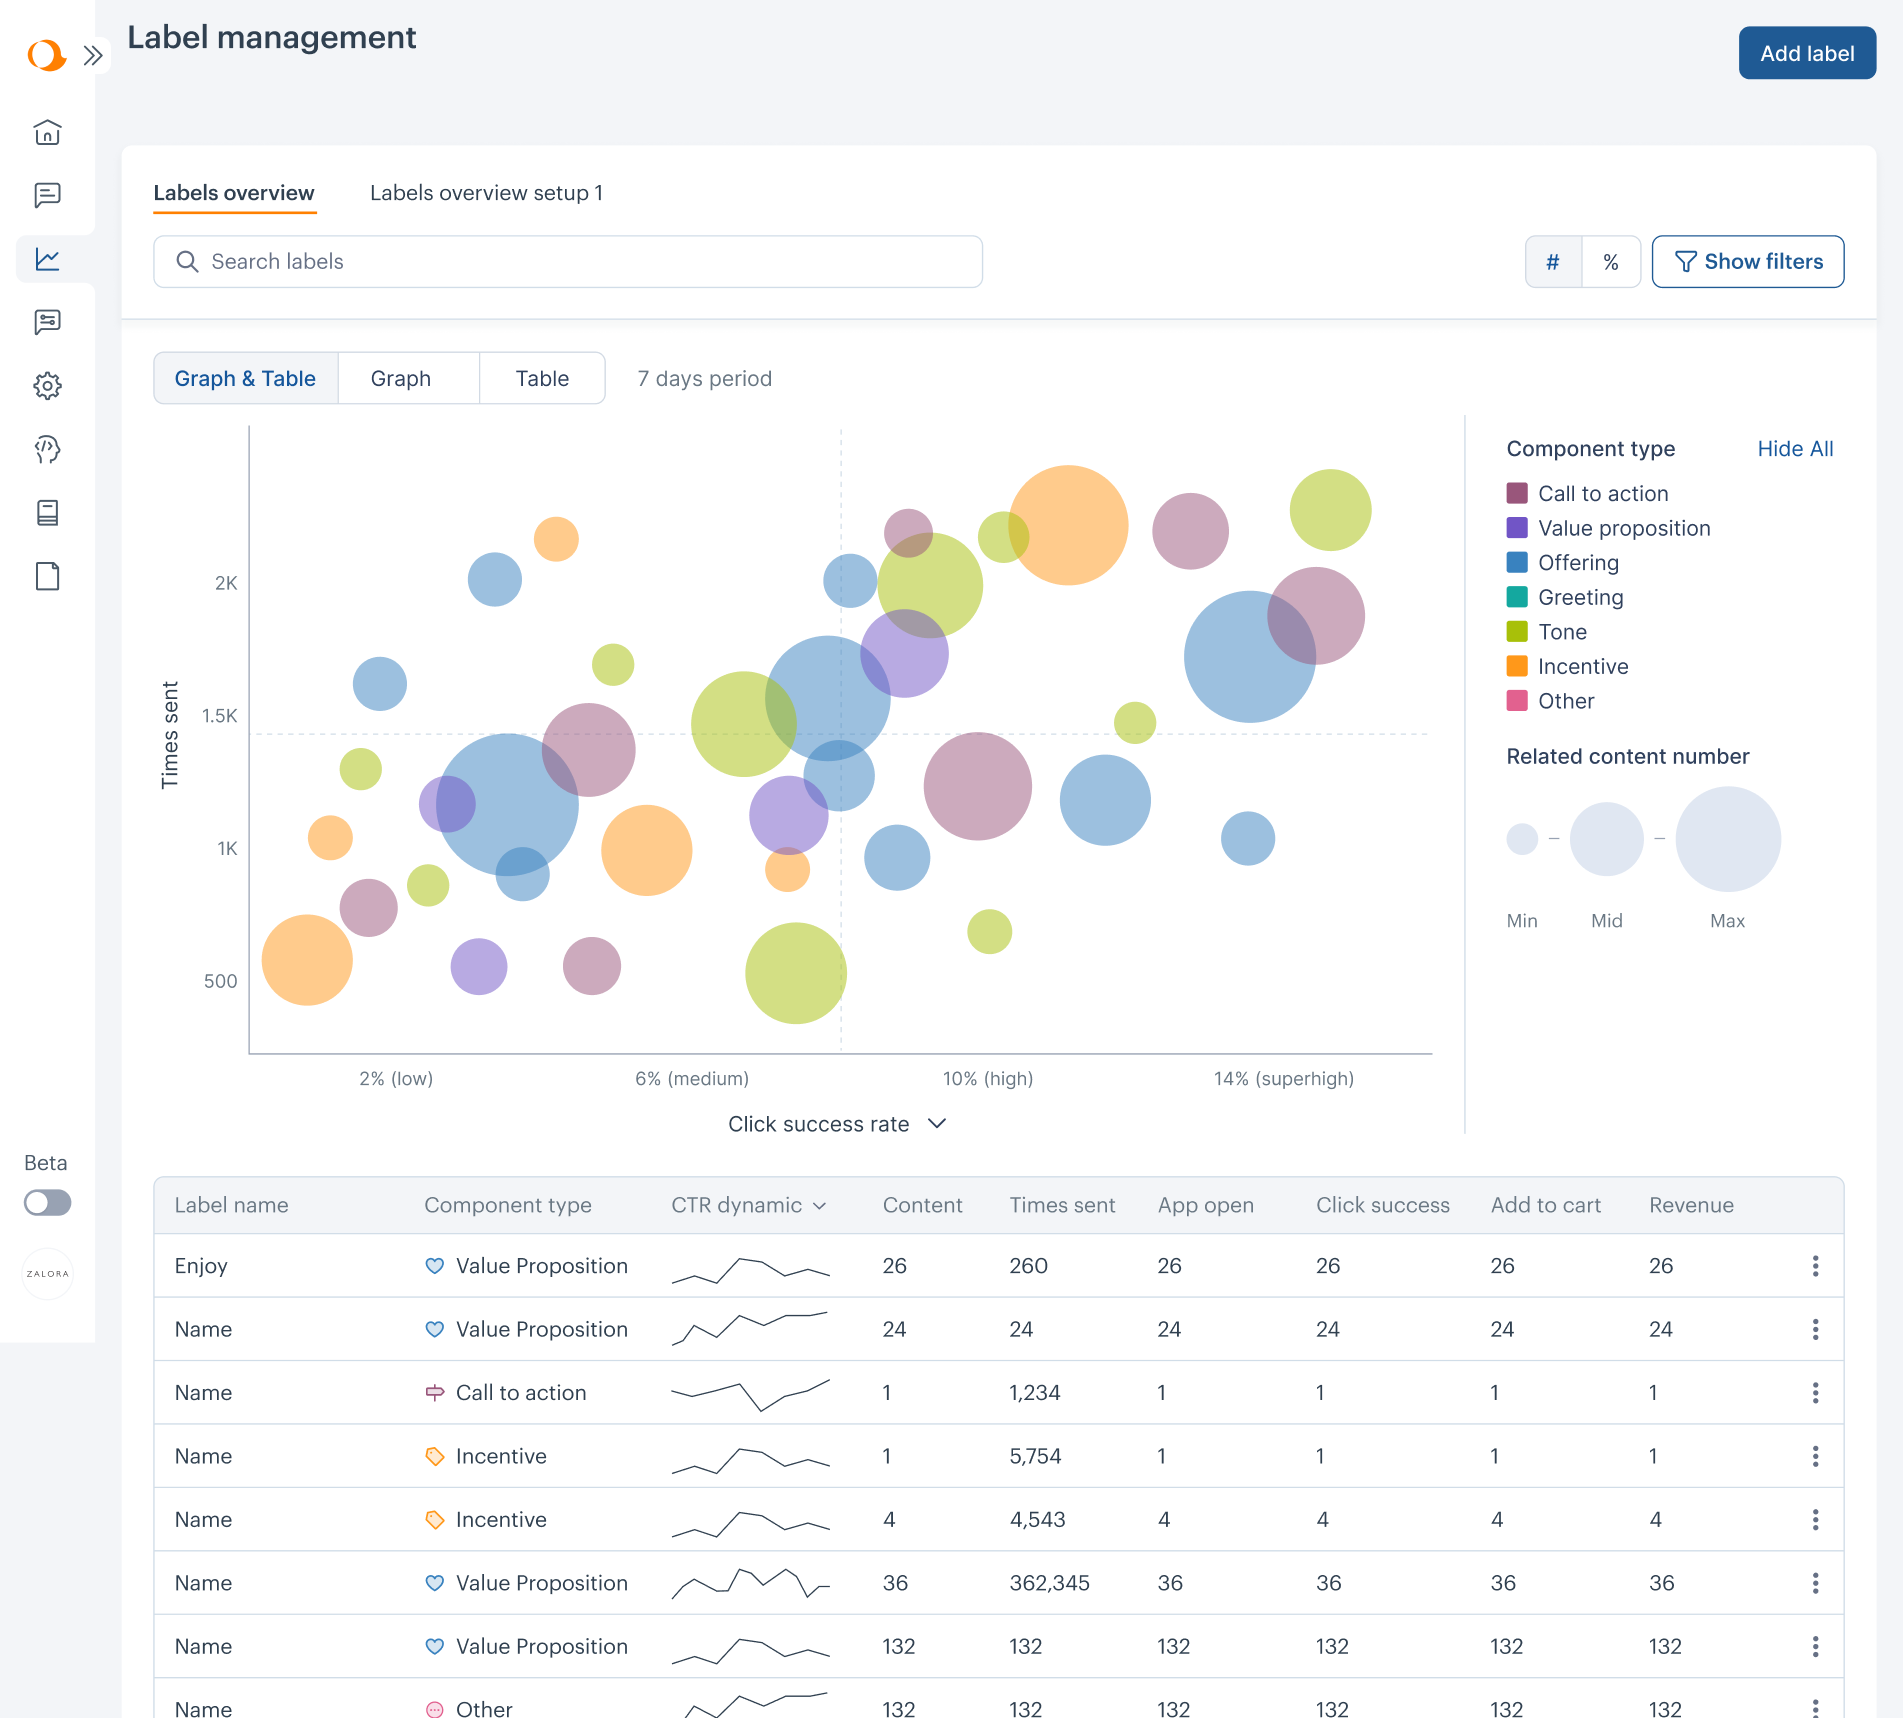
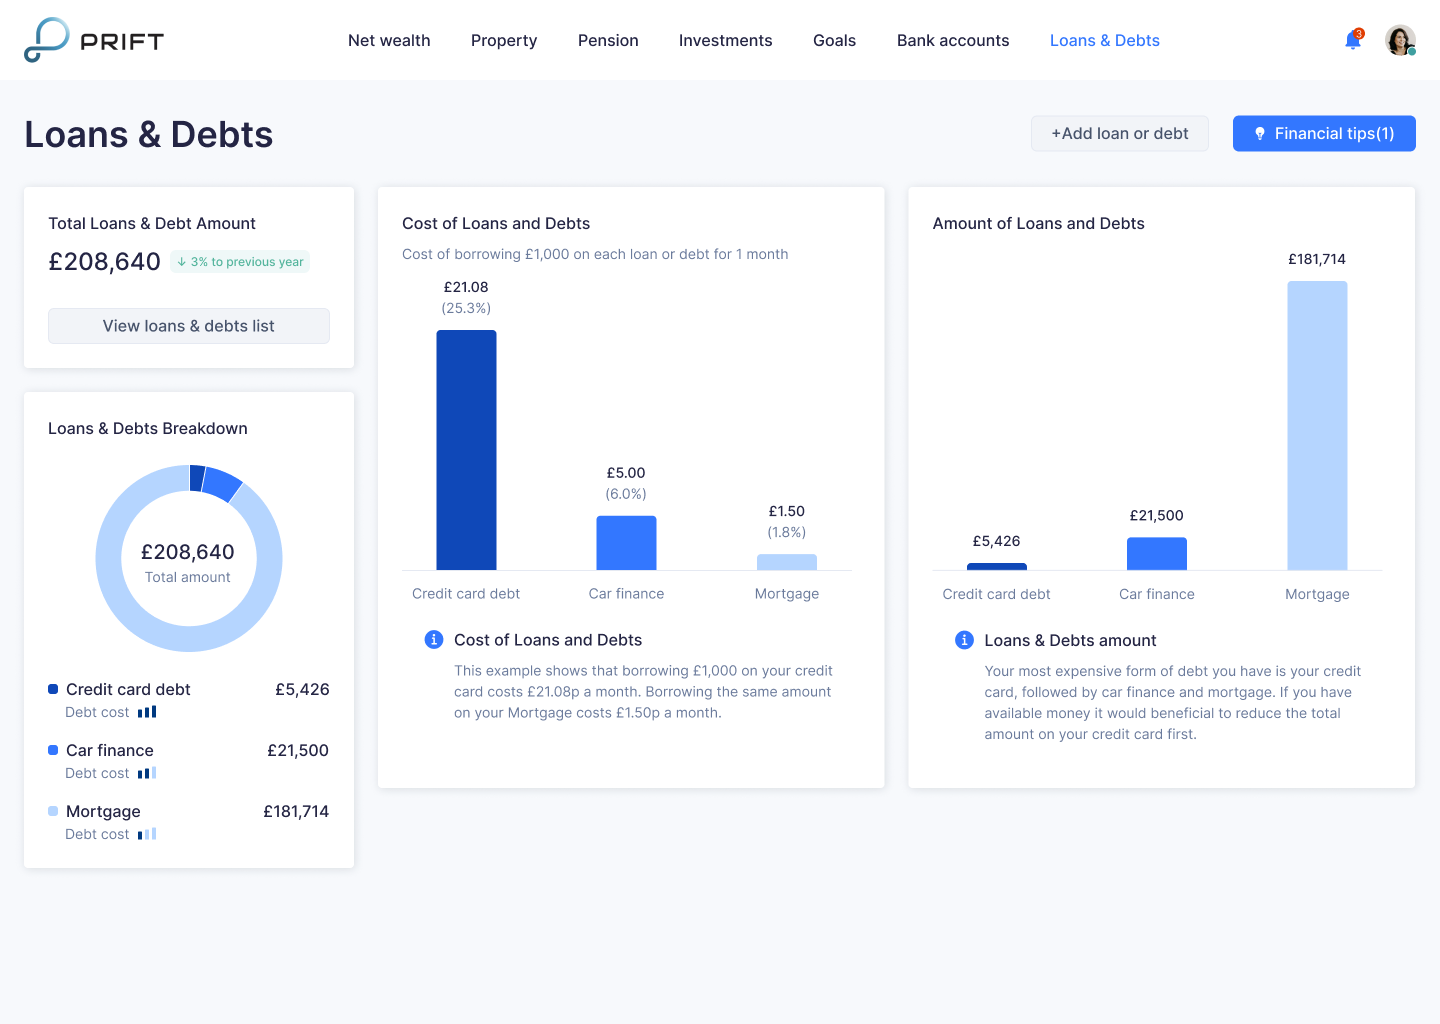
At Eleken, we’ve seen how clear labeling and data visualization design can completely change how users interact with dashboards. When Aampe, an AI marketing platform, came to us, their label performance data was presented as a dense table that made it hard for users to understand which usability metrics truly mattered.
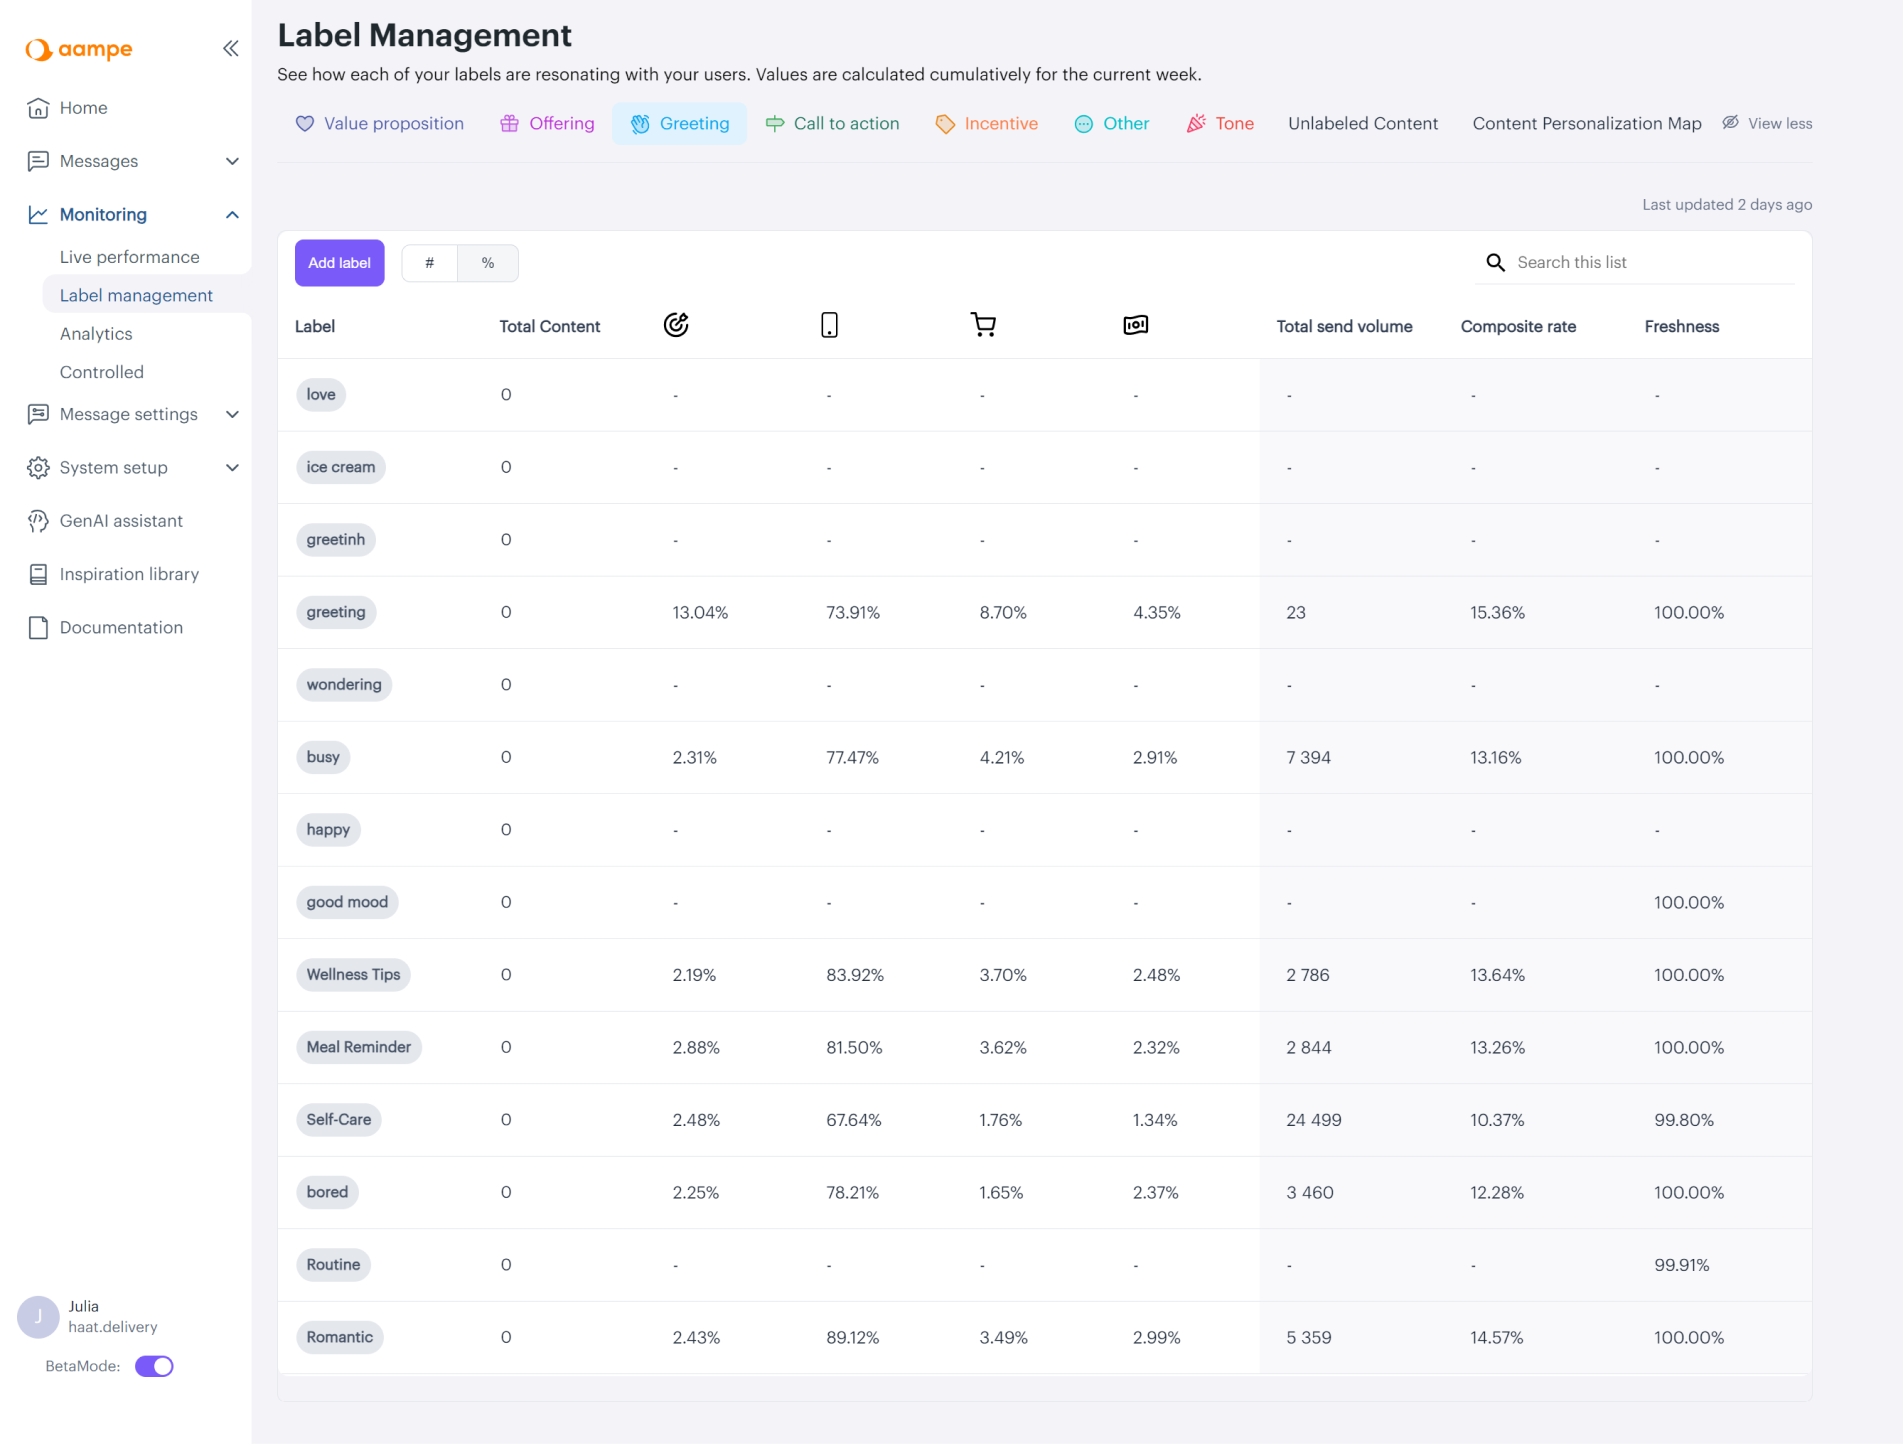
So, we redesigned the entire view into a clear, visual dashboard — replacing tables with labeled bubble charts and sparklines that instantly showed performance trends. After the update, Aampe’s clients could grasp insights at a glance instead of scrolling through rows of data, proving how much clarity impacts usability.
2. White space and layout
A cluttered dashboard is a confused dashboard. White space isn’t “wasted space” — it’s what makes your data readable. Make sure there’s enough breathing room between cards, relevant charts, and sections. Visual separation helps the brain process information faster.
Follow a consistent grid so everything lines up neatly. Related charts — like revenue and churn — should live close together, while unrelated ones should have visible boundaries. Use padding and section dividers to help the eye travel smoothly across the layout. A simple rule of thumb: if your dashboard looks busy, remove something. The best dashboards feel effortless to scan because they give each data point room to shine.
3. Visual hierarchy
Visual hierarchy is what guides the viewer’s attention — it’s how you show what’s most important first. Start by identifying your top three metrics and placing them in the most prominent area (usually top-left or center). These are your “north star” numbers.
Then, use size and weight to build structure: headline numbers should be large and bold; supporting charts can be smaller and lighter. Use spacing and alignment to create a clear visual path, remembering that users naturally scan in an F-shaped or Z-shaped pattern.
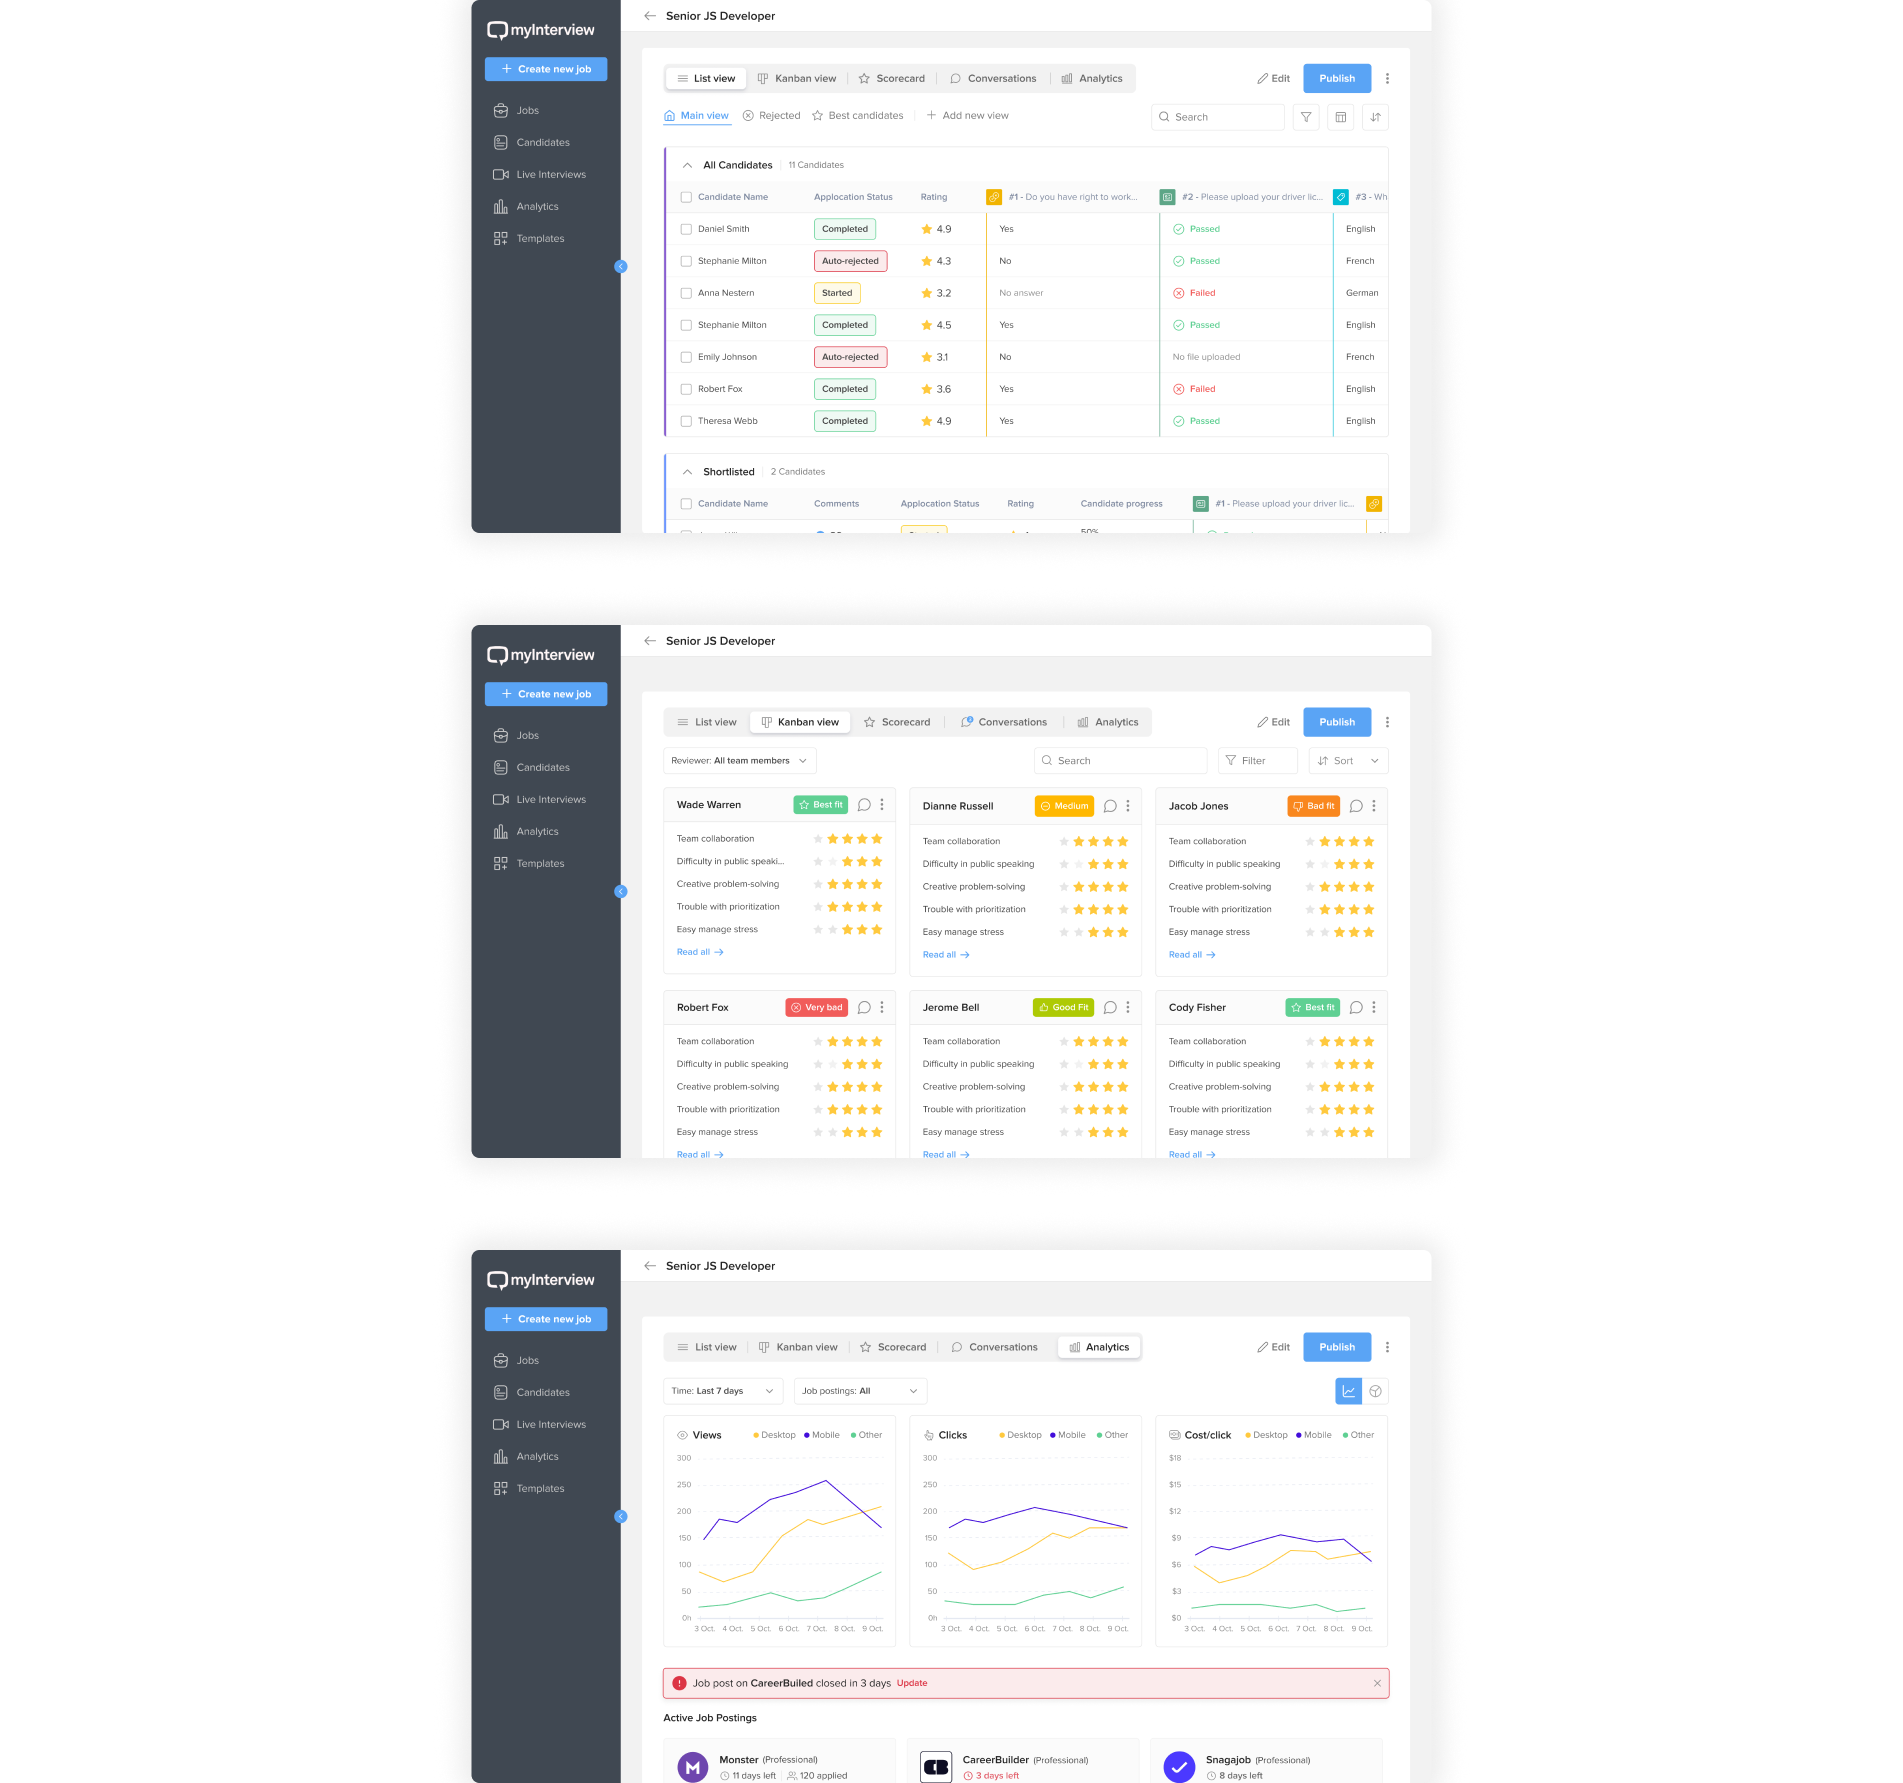
When we worked with MyInterview, we used the same principle to bring structure and clarity to their analytics dashboard. By introducing clear top-level tabs — List View, Kanban View, Scorecard, Conversations, and Analytics — we helped users instantly find the data they needed and focus on key insights first. The result was a cleaner, more intuitive layout where important metrics naturally stood out.
4. Color and accessibility
Color can make or break comprehension, so use it deliberately. Assign consistent colors to categories (e.g., blue for revenue, orange for churn) and avoid random palettes that confuse the viewer. Also, keep contrast high enough that text and numbers are easy to read, even on smaller screens.
That said, never rely on color alone to convey meaning. If green means "good" and red means "bad," reinforce that with icons or labels so users with color vision deficiencies still get the message. For example, pair a green upward arrow with "+15% growth" or a red down arrow with "–3% churn".
Beyond color, accessibility extends to typography and structure too. Use legible font sizes (14–16px minimum for body text), make sure interactive elements can be reached via keyboard, and confirm screen readers can interpret key metrics if your product requires compliance.
This is the moment to slow down and fine-tune. Walk through your dashboard with fresh eyes — can you instantly spot what matters? By applying these human-centered principles, you'll transform a mechanical AI output into a dashboard people actually enjoy using.
Step 4 — Add business context
At this point, your dashboard looks polished. The layout works, the colors make sense, the data flows. But something’s still missing — the story.
AI can visualize numbers, but it doesn’t understand what those numbers mean for your business. That’s your role: to turn visuals into context, and context into clarity.
Annotated charts
Start by giving your data a voice. Numbers move, but people need to know why.
Add short notes that tell the story behind the spikes and dips — maybe it was a campaign launch, a seasonal effect, or an unexpected outage. These annotations anchor your charts in reality, helping users instantly understand cause and effect. Even a small phrase beside a graph can shift it from a visual to a narrative. From “something happened” to “here’s why it matters”.
Benchmarks and targets
Next, set the stage. A churn rate of 5% means nothing until you compare it to something. By layering in reference points — an industry average, a quarterly goal, or even last month’s performance — you give numbers their meaning.
A simple “Goal: <4%” note or a thin line across a chart can change how people interpret an entire dashboard. Suddenly, performance isn’t abstract — it’s measured, contextualized, and alive with intention.
Custom tooltips
Finally, keep your dashboard clean while still rewarding curiosity. Add interactive tooltips that whisper the details only when someone asks for them.
Hovering over a bar might reveal “Q2 Sales: $1.2M (10% YoY growth)”, or a KPI card might show how a “Customer Health Score” is calculated. These micro-explanations keep the dashboard approachable for newcomers yet powerful for analysts who want to dig deeper — a balance that separates a beautiful chart from a truly usable tool.
Whether you're stuck at step 2, polishing layouts at step 3, or refining the final context in step 4, we can help.
At Eleken, we've spent over a decade turning AI-generated dashboards into intuitive, SaaS-ready experiences that actually drive decisions. If you need a hand building or refining yours, reach out — we'll help your data not just look good, but make sense!
Real dashboard design examples: what works and what doesn’t
Still with us? We’ve thrown quite a bit your way — tools, workflows, design rules, you name it. And honestly, it can feel like a lot when all you want is a dashboard that just works. So, let’s take a breather and look at what all of this actually looks like in practice.
In this part, we’ll walk through some real dashboard design examples — the good, the bad, and the “please don’t do that” — to show what separates a usable dashboard from a confusing mess.
LogitudeWorld: turning complex logistics data into an intuitive dashboard
One day, LogitudeWorld, a freight forwarding SaaS company, came to us with a challenge. They wanted to expand into a new market by creating a shipment-tracking platform that their clients’ clients — people who weren’t necessarily tech-savvy — could actually use. On top of that, the platform needed to be white-label, so every client could customize it without breaking the design.
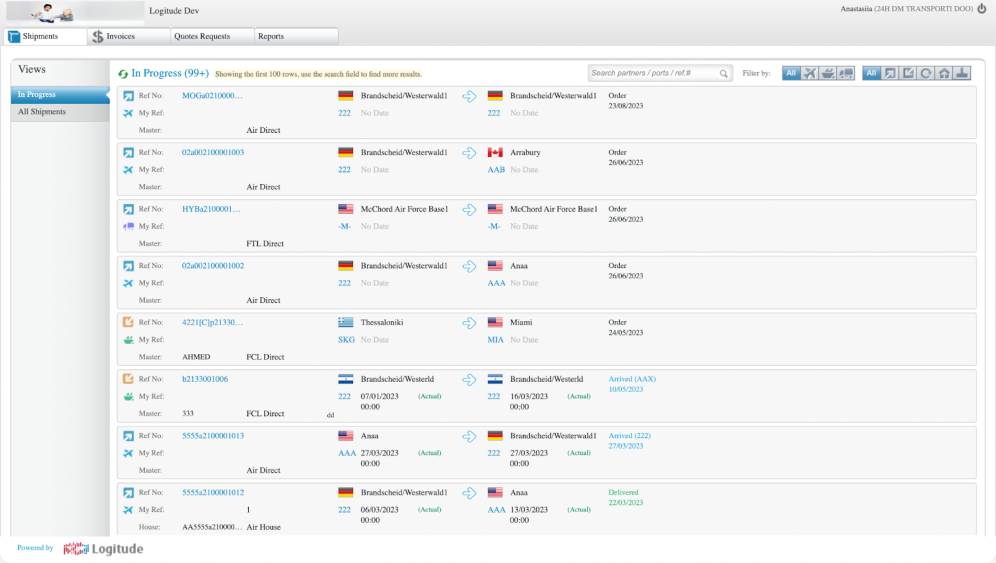
At first, their dashboard tried to do too much. The data blocks were scattered, icons were unclear, and key filters were tucked away under hard-to-find buttons. It looked functional but felt overwhelming — not exactly what you want when you’re just trying to track a shipment.
So, we went back to the drawing board. Our goal was to make the experience effortless: fewer clicks, clearer hierarchy, and visual cues that make sense at a glance.
- We moved filters to a sidebar, keeping them visible at all times.
- Added labels and tooltips so users never had to guess what an icon meant.
- Introduced a calendar and an interactive map for real-time updates.
- Designed color-coordinated themes to make white-label customization easy but consistent.
The result? A dashboard that feels light, logical, and human, balancing usability with flexibility. What started as a cluttered application interface design turned into one that helps users make decisions in seconds instead of minutes.
Kipsi: from cluttered prototype to clean, client-ready dashboard
Another great example of clarity beating clutter comes from Kipsi, a platform that helps accounting and consulting firms manage R&D tax credit projects. When the team first reached out to us, they already had some mockups in place — but the layouts felt heavy, the navigation was confusing, and important details were buried under layers of clicks.
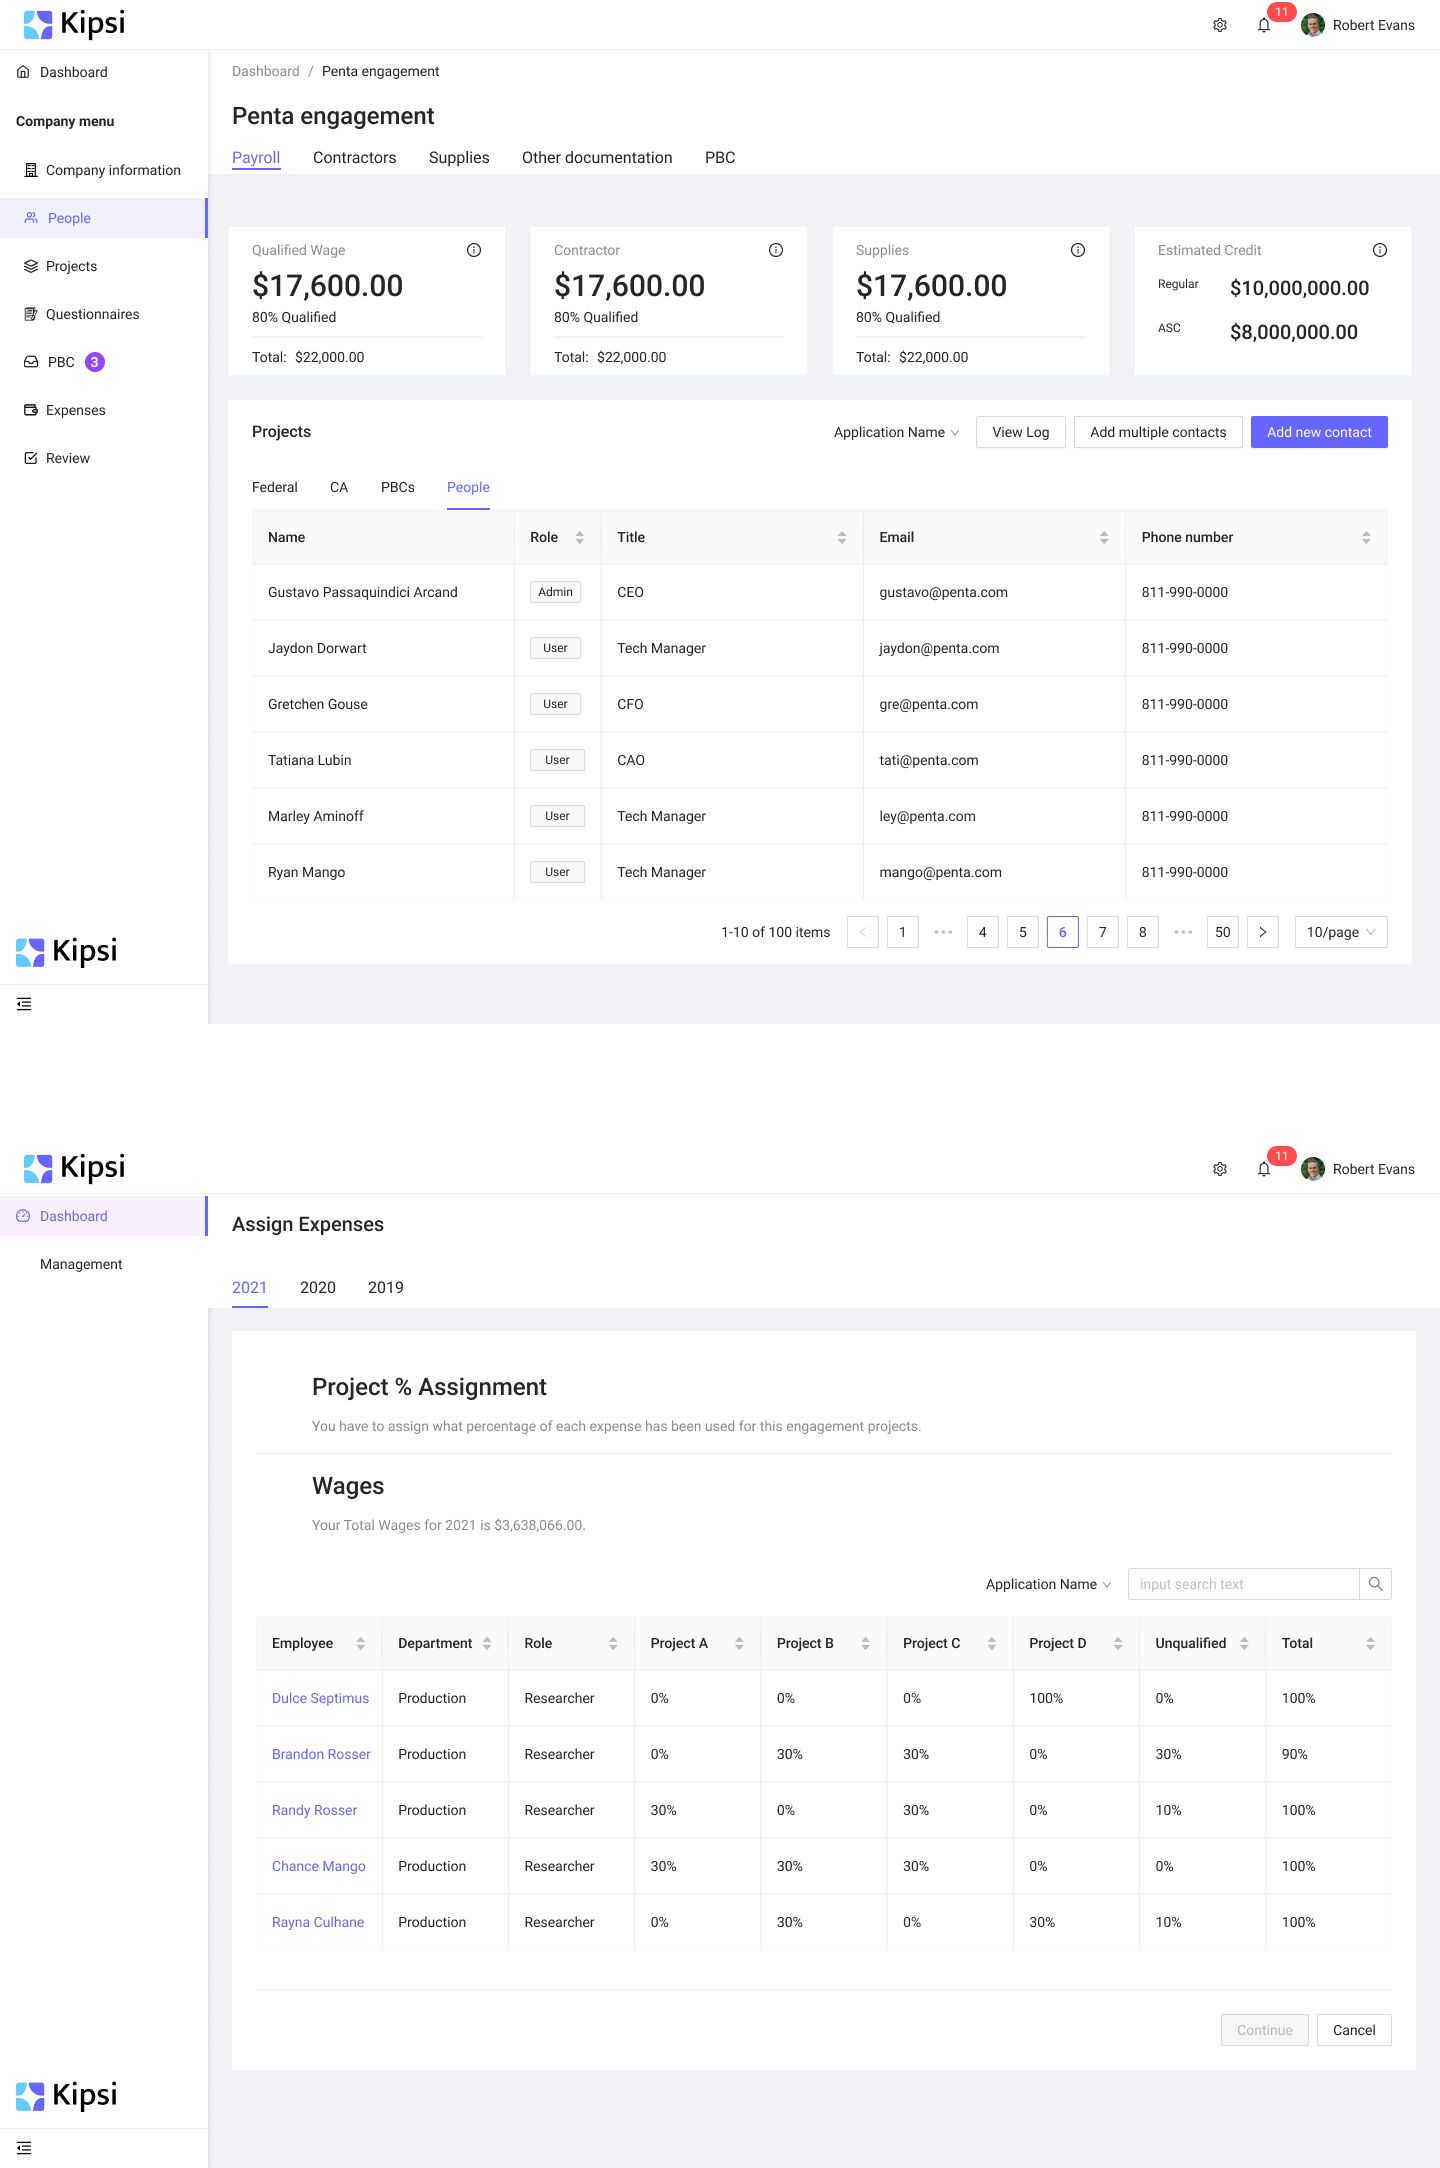
So, we stripped it down to what mattered most. Our designer reorganized the entire structure, making navigation intuitive and breaking it into two simple levels: one on top for high-level sections and one on the side for in-depth tasks. We reduced cognitive load by removing unnecessary columns, created cleaner tables, and added a clear visual hierarchy to guide the eye.
The result was a dashboard where every piece of information has its place, and users can focus on work instead of wrestling with layout chaos.
And if you want even more dashboard design examples along with best practices, consider watching this video:
Data table vs. Metric card vs. KPI visualization
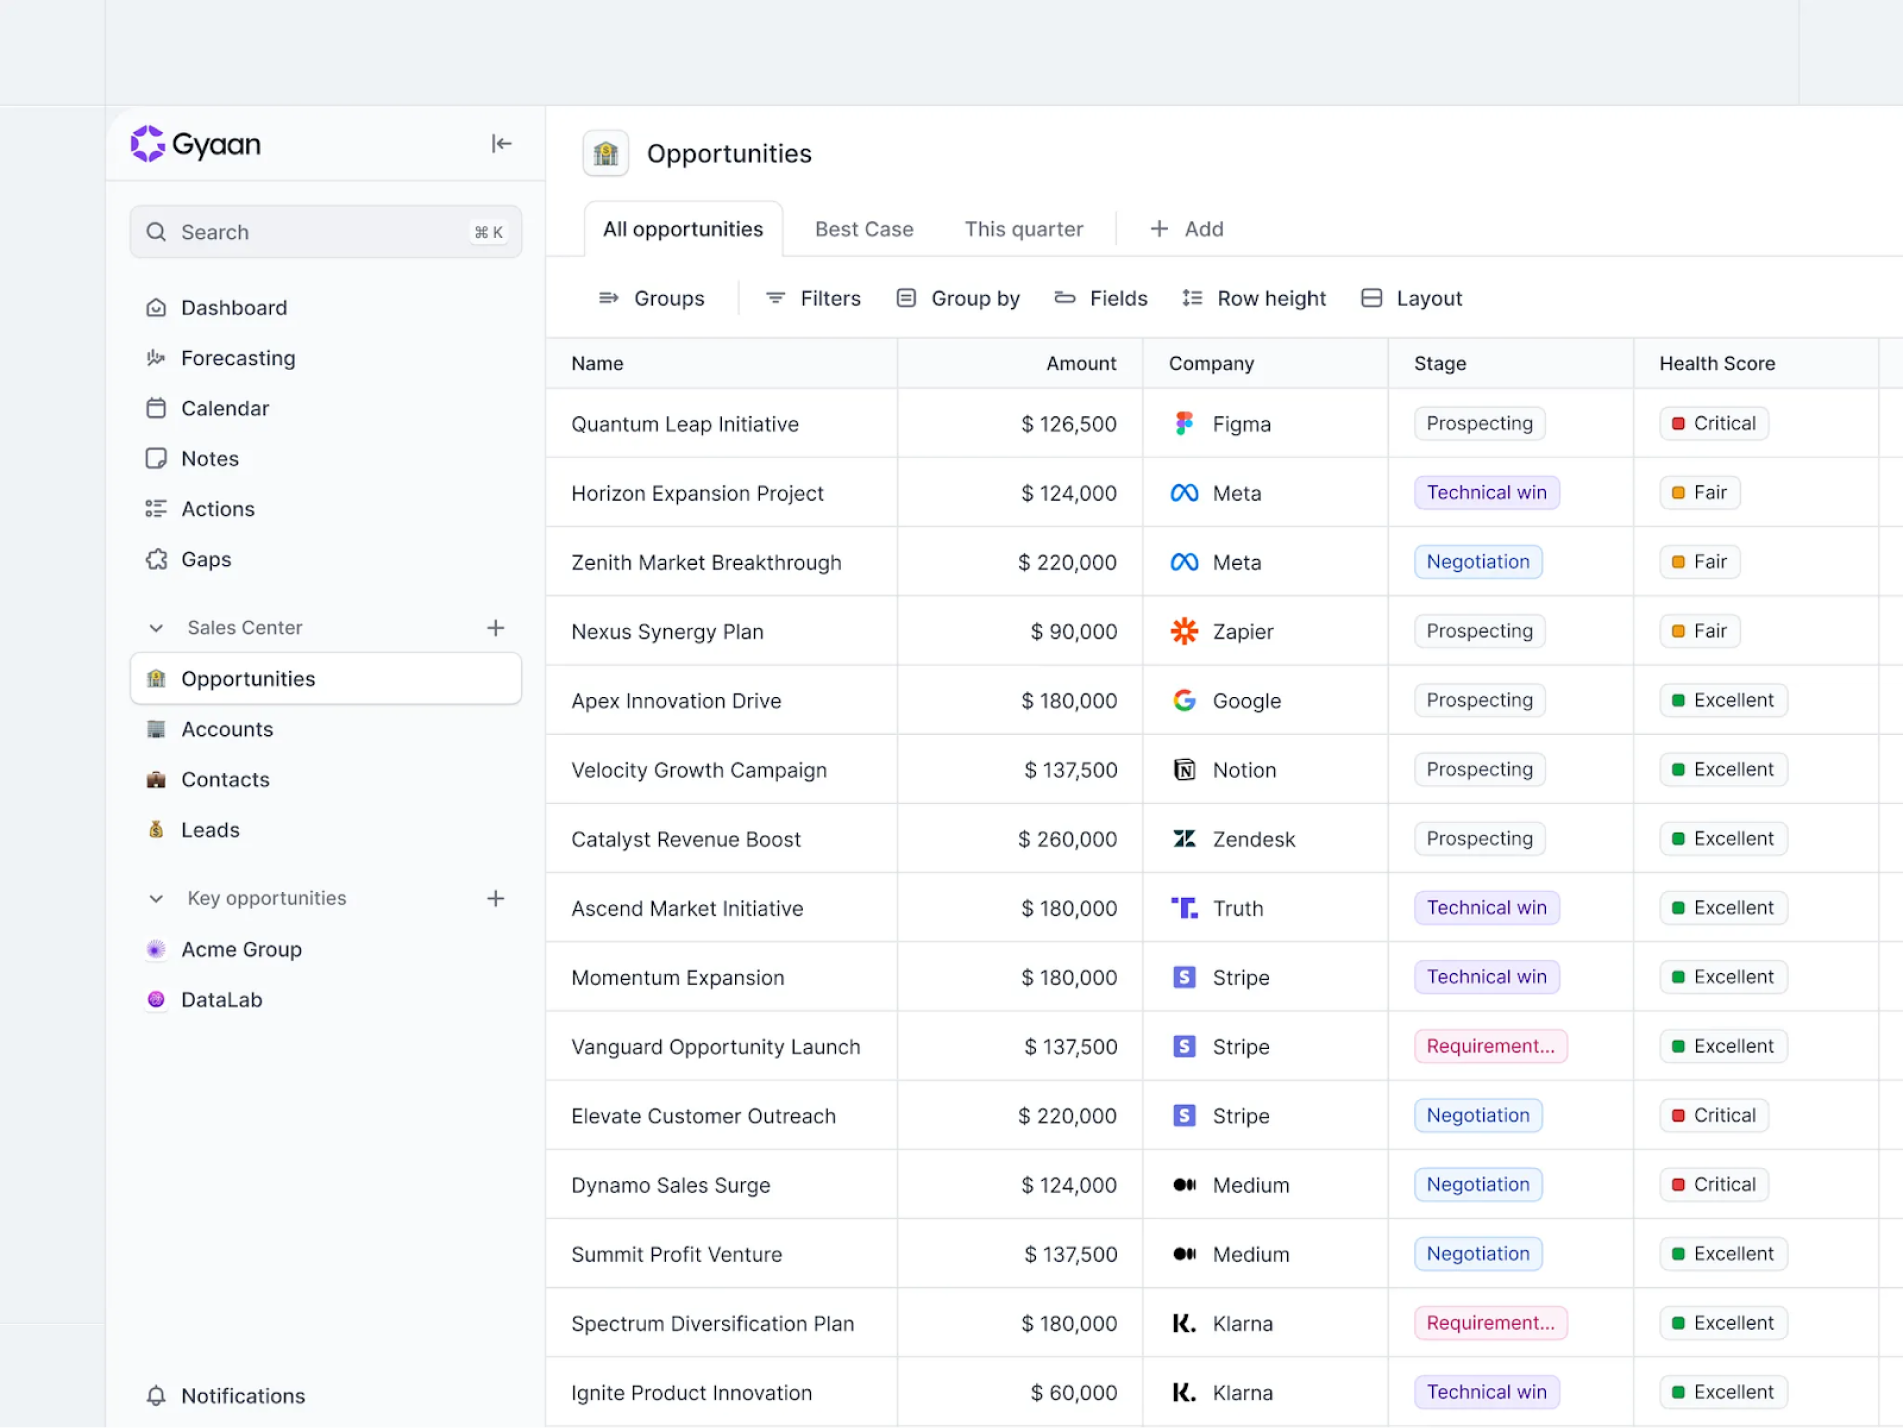
There’s also more than one way to visualize data inside a dashboard — and each serves a different purpose. To show how they work (and when to use them), let’s look at a few examples, starting with the classic data table.
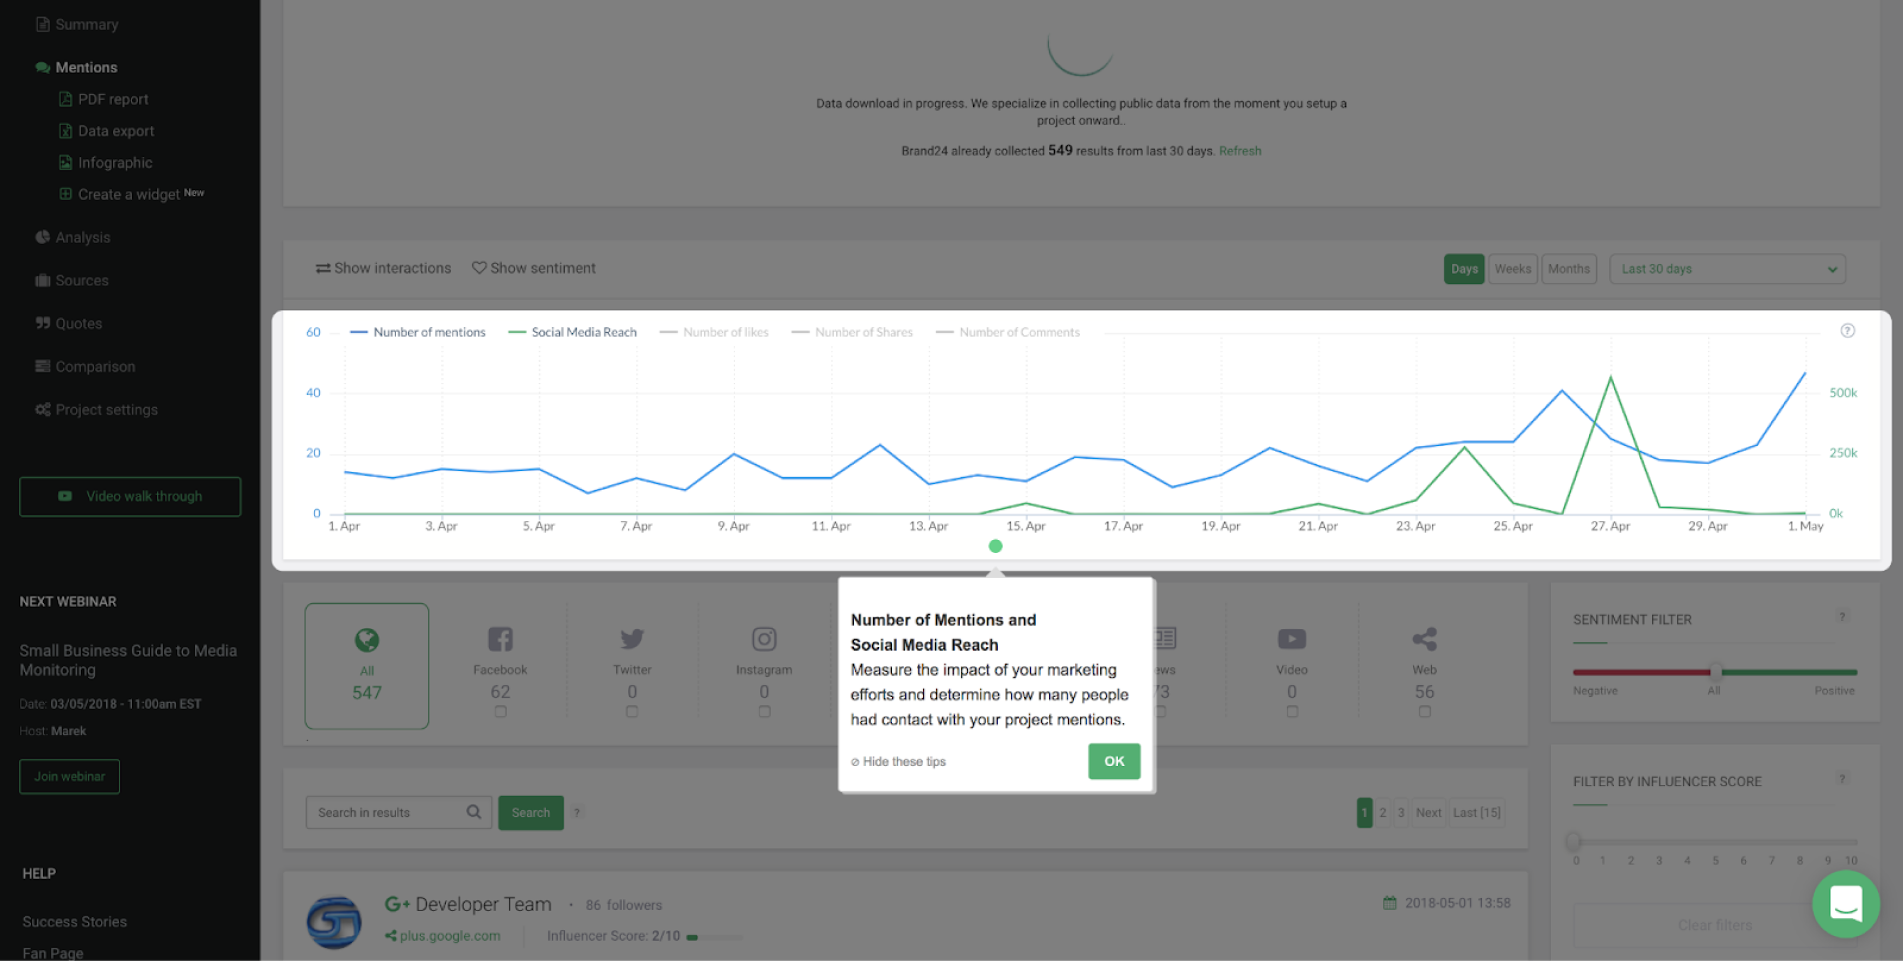
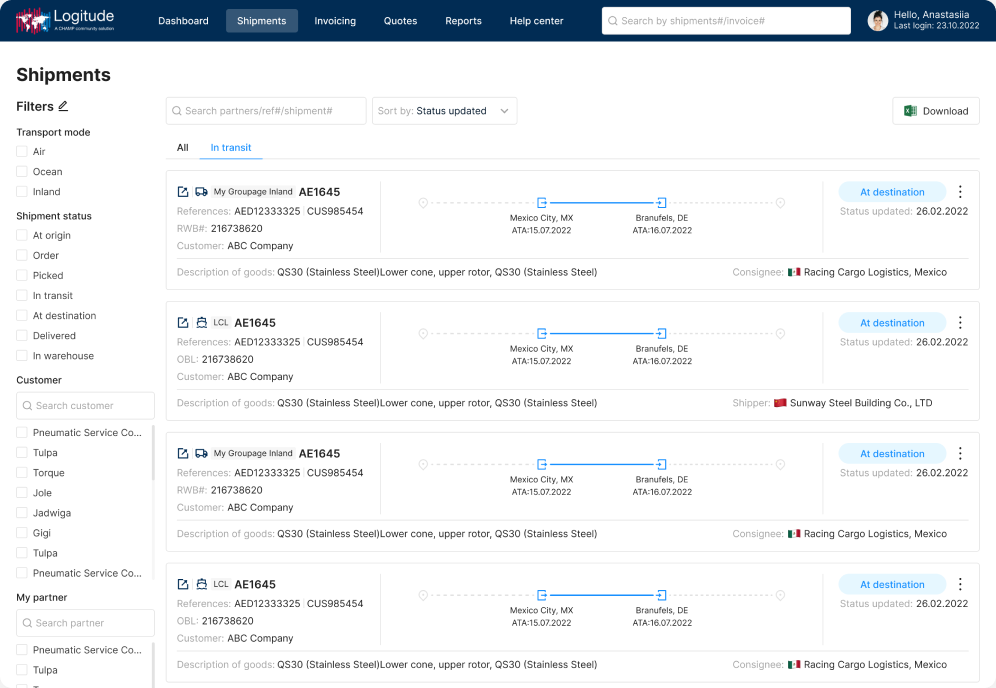
Data tables are the backbone of many SaaS dashboards. They’re perfect when users need to dig into specifics — like transactions, shipments, or sales opportunities — without losing context. But when they’re done wrong, they can feel like spreadsheets from hell.
The example below shows how a well-designed table can turn dense data into something readable. Consistent alignment, subtle color coding for health scores, and clear hierarchy between columns help the user find what they need fast without mental breakdown.
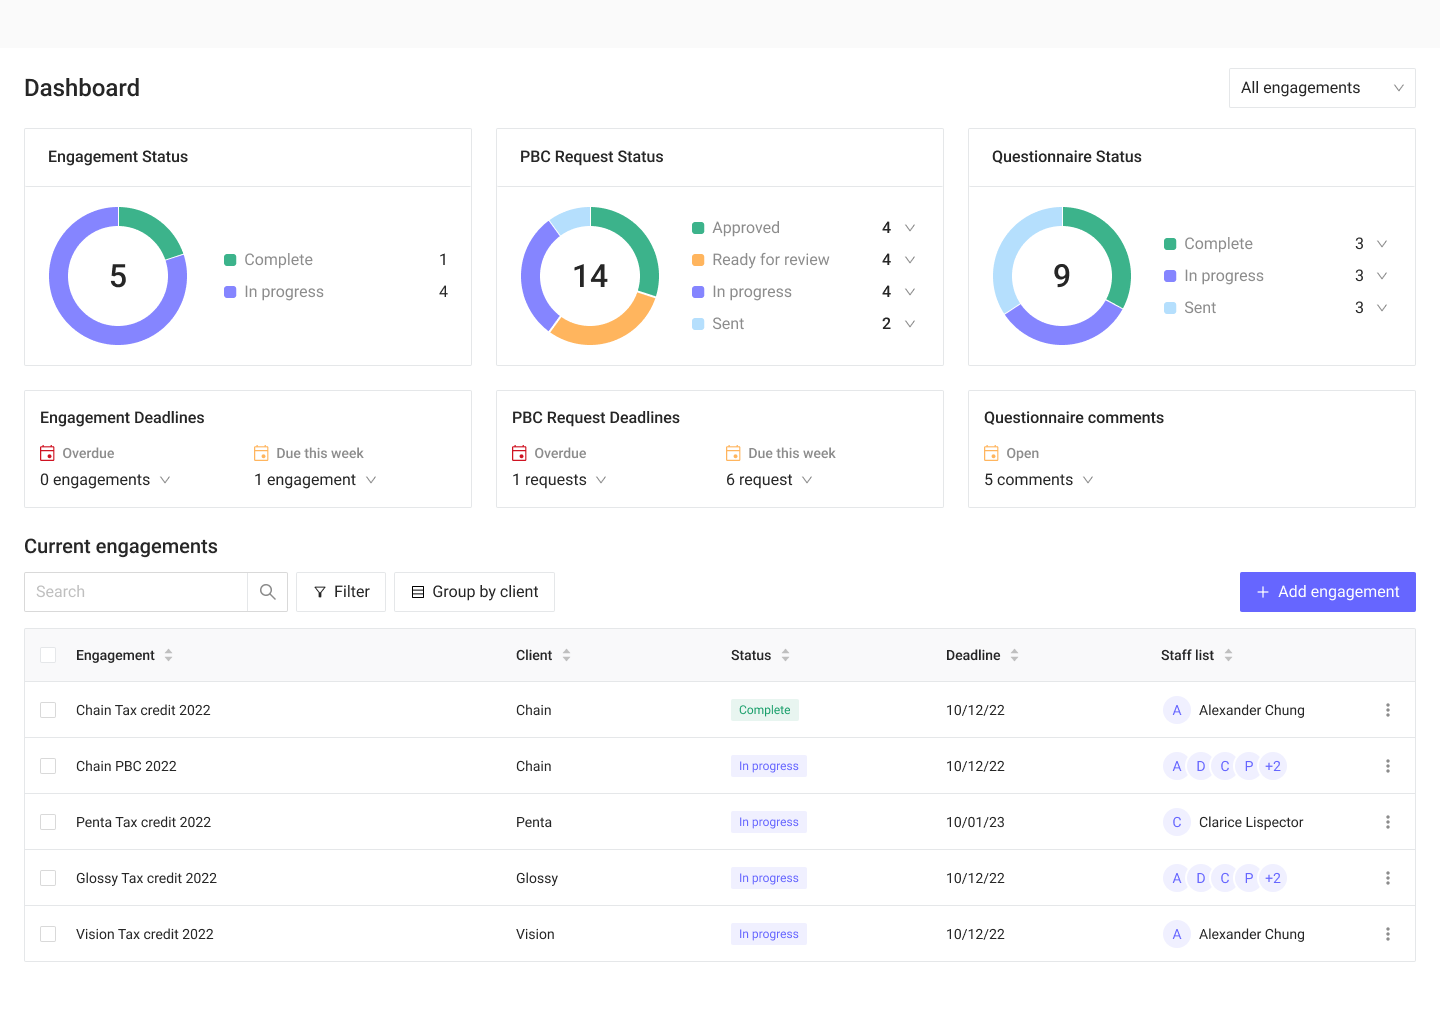
Next up — metric cards.
If data tables are about depth, metric cards are about speed. They show the headline numbers — the KPIs that tell you how things are going without forcing you to dig in. The design below is a solid example. Each card focuses on one clear metric — publications, tests, users, revenue — with small color-coded indicators for growth or decline. No noise, no extra details. Just the essentials, laid out so your brain can process them in seconds.
This kind of layout works perfectly for leadership or operations dashboards where the goal is to scan, not analyze. But it’s also a reminder: if everything’s a KPI card, nothing stands out. Use them sparingly, to highlight what actually drives decisions.
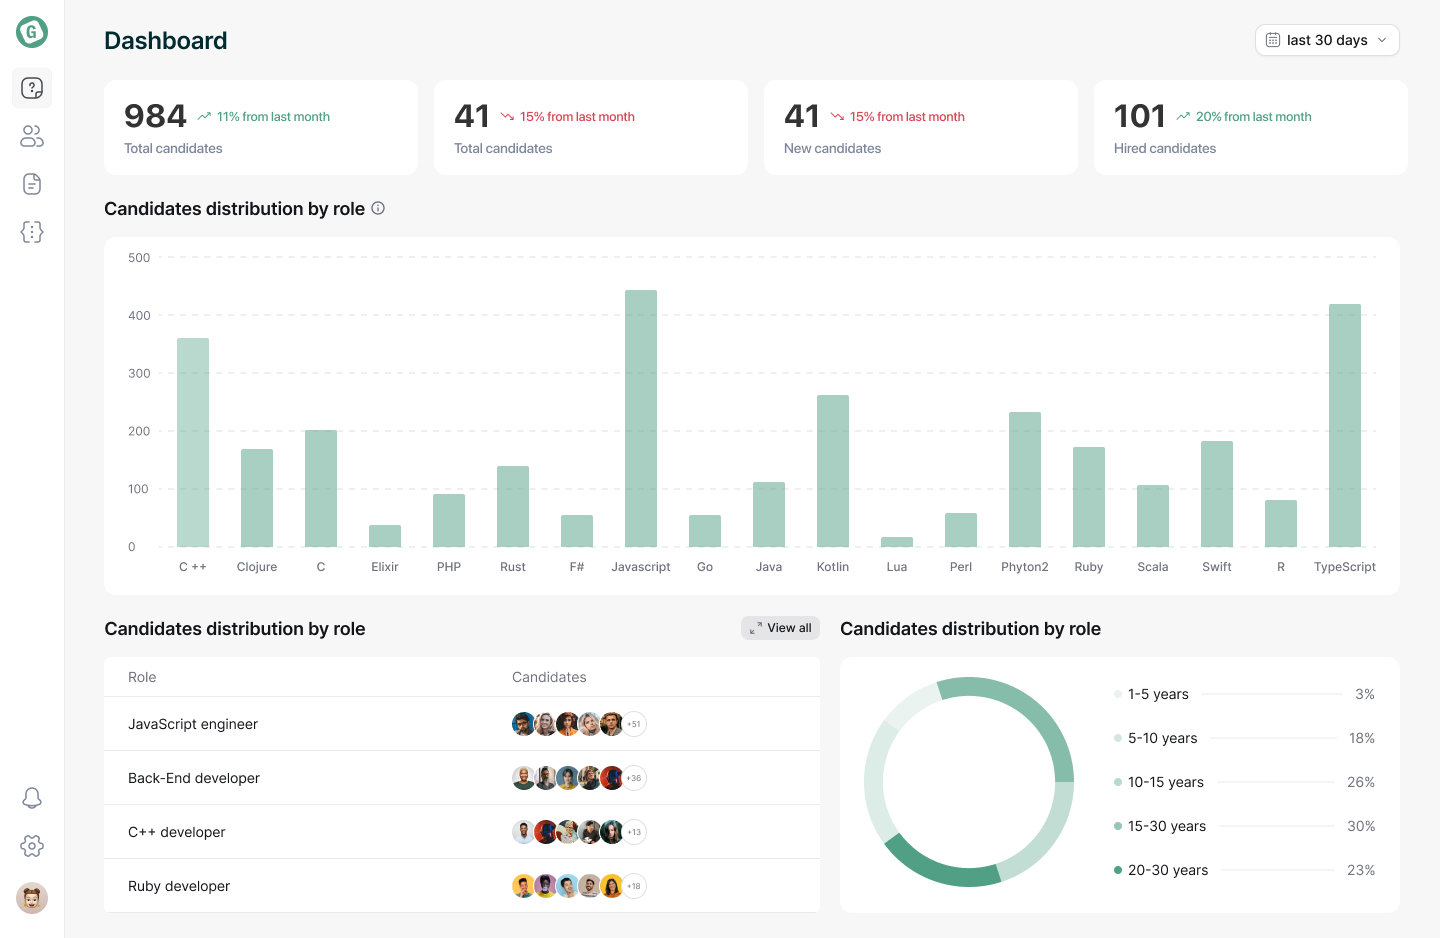
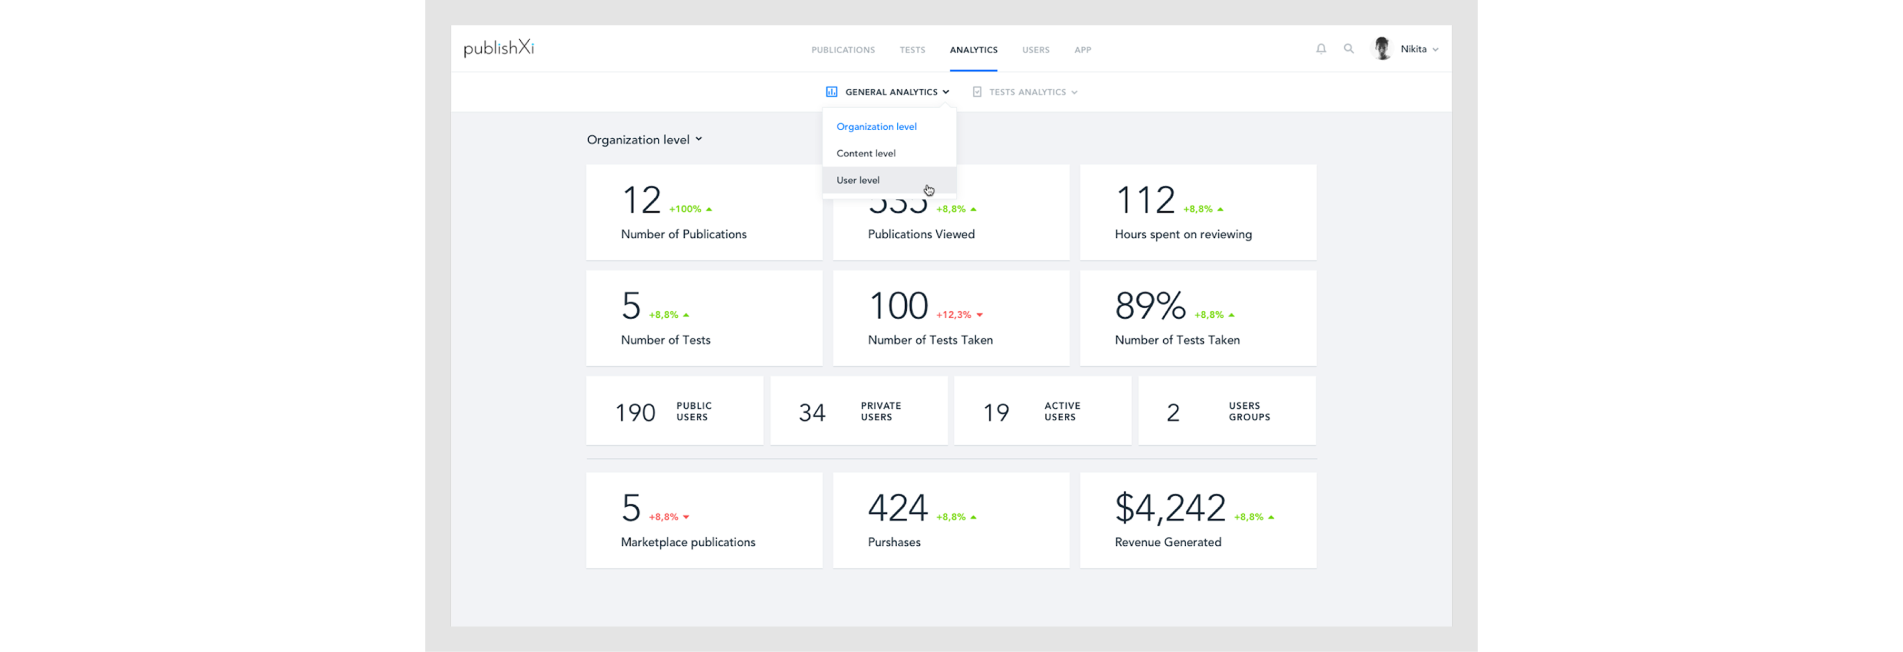
And finally — KPI visualizations.
When you need to show progress, not just numbers, charts step in. Visualizations turn data into patterns you can actually see — trends, proportions, and anomalies that tables or cards can’t capture.
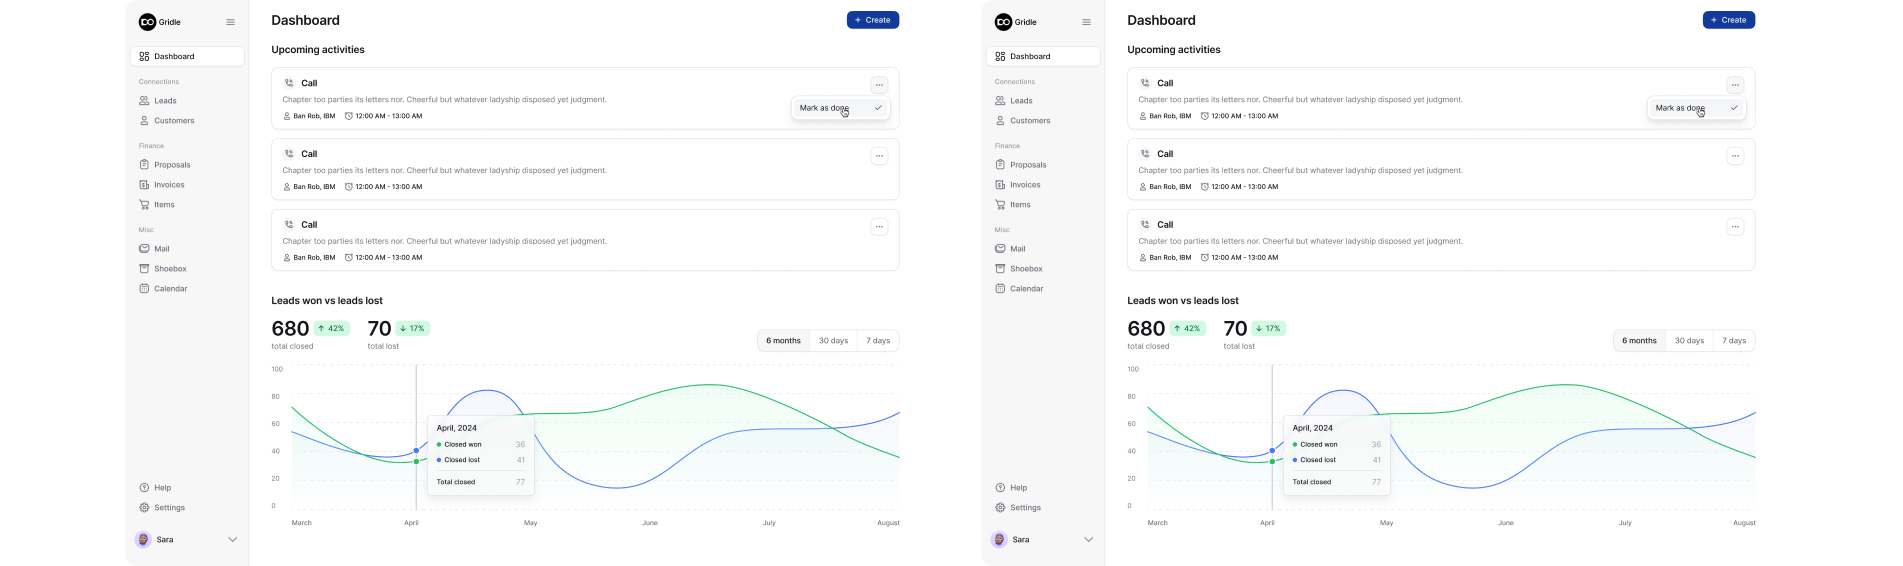
Take this dashboard from Gridle, a client experience platform. It combines multiple chart types to make each dataset instantly recognizable. The pie chart breaks down lead sources, the bar chart shows how many leads are in each stage of the funnel, and the line graph tracks changes over time.
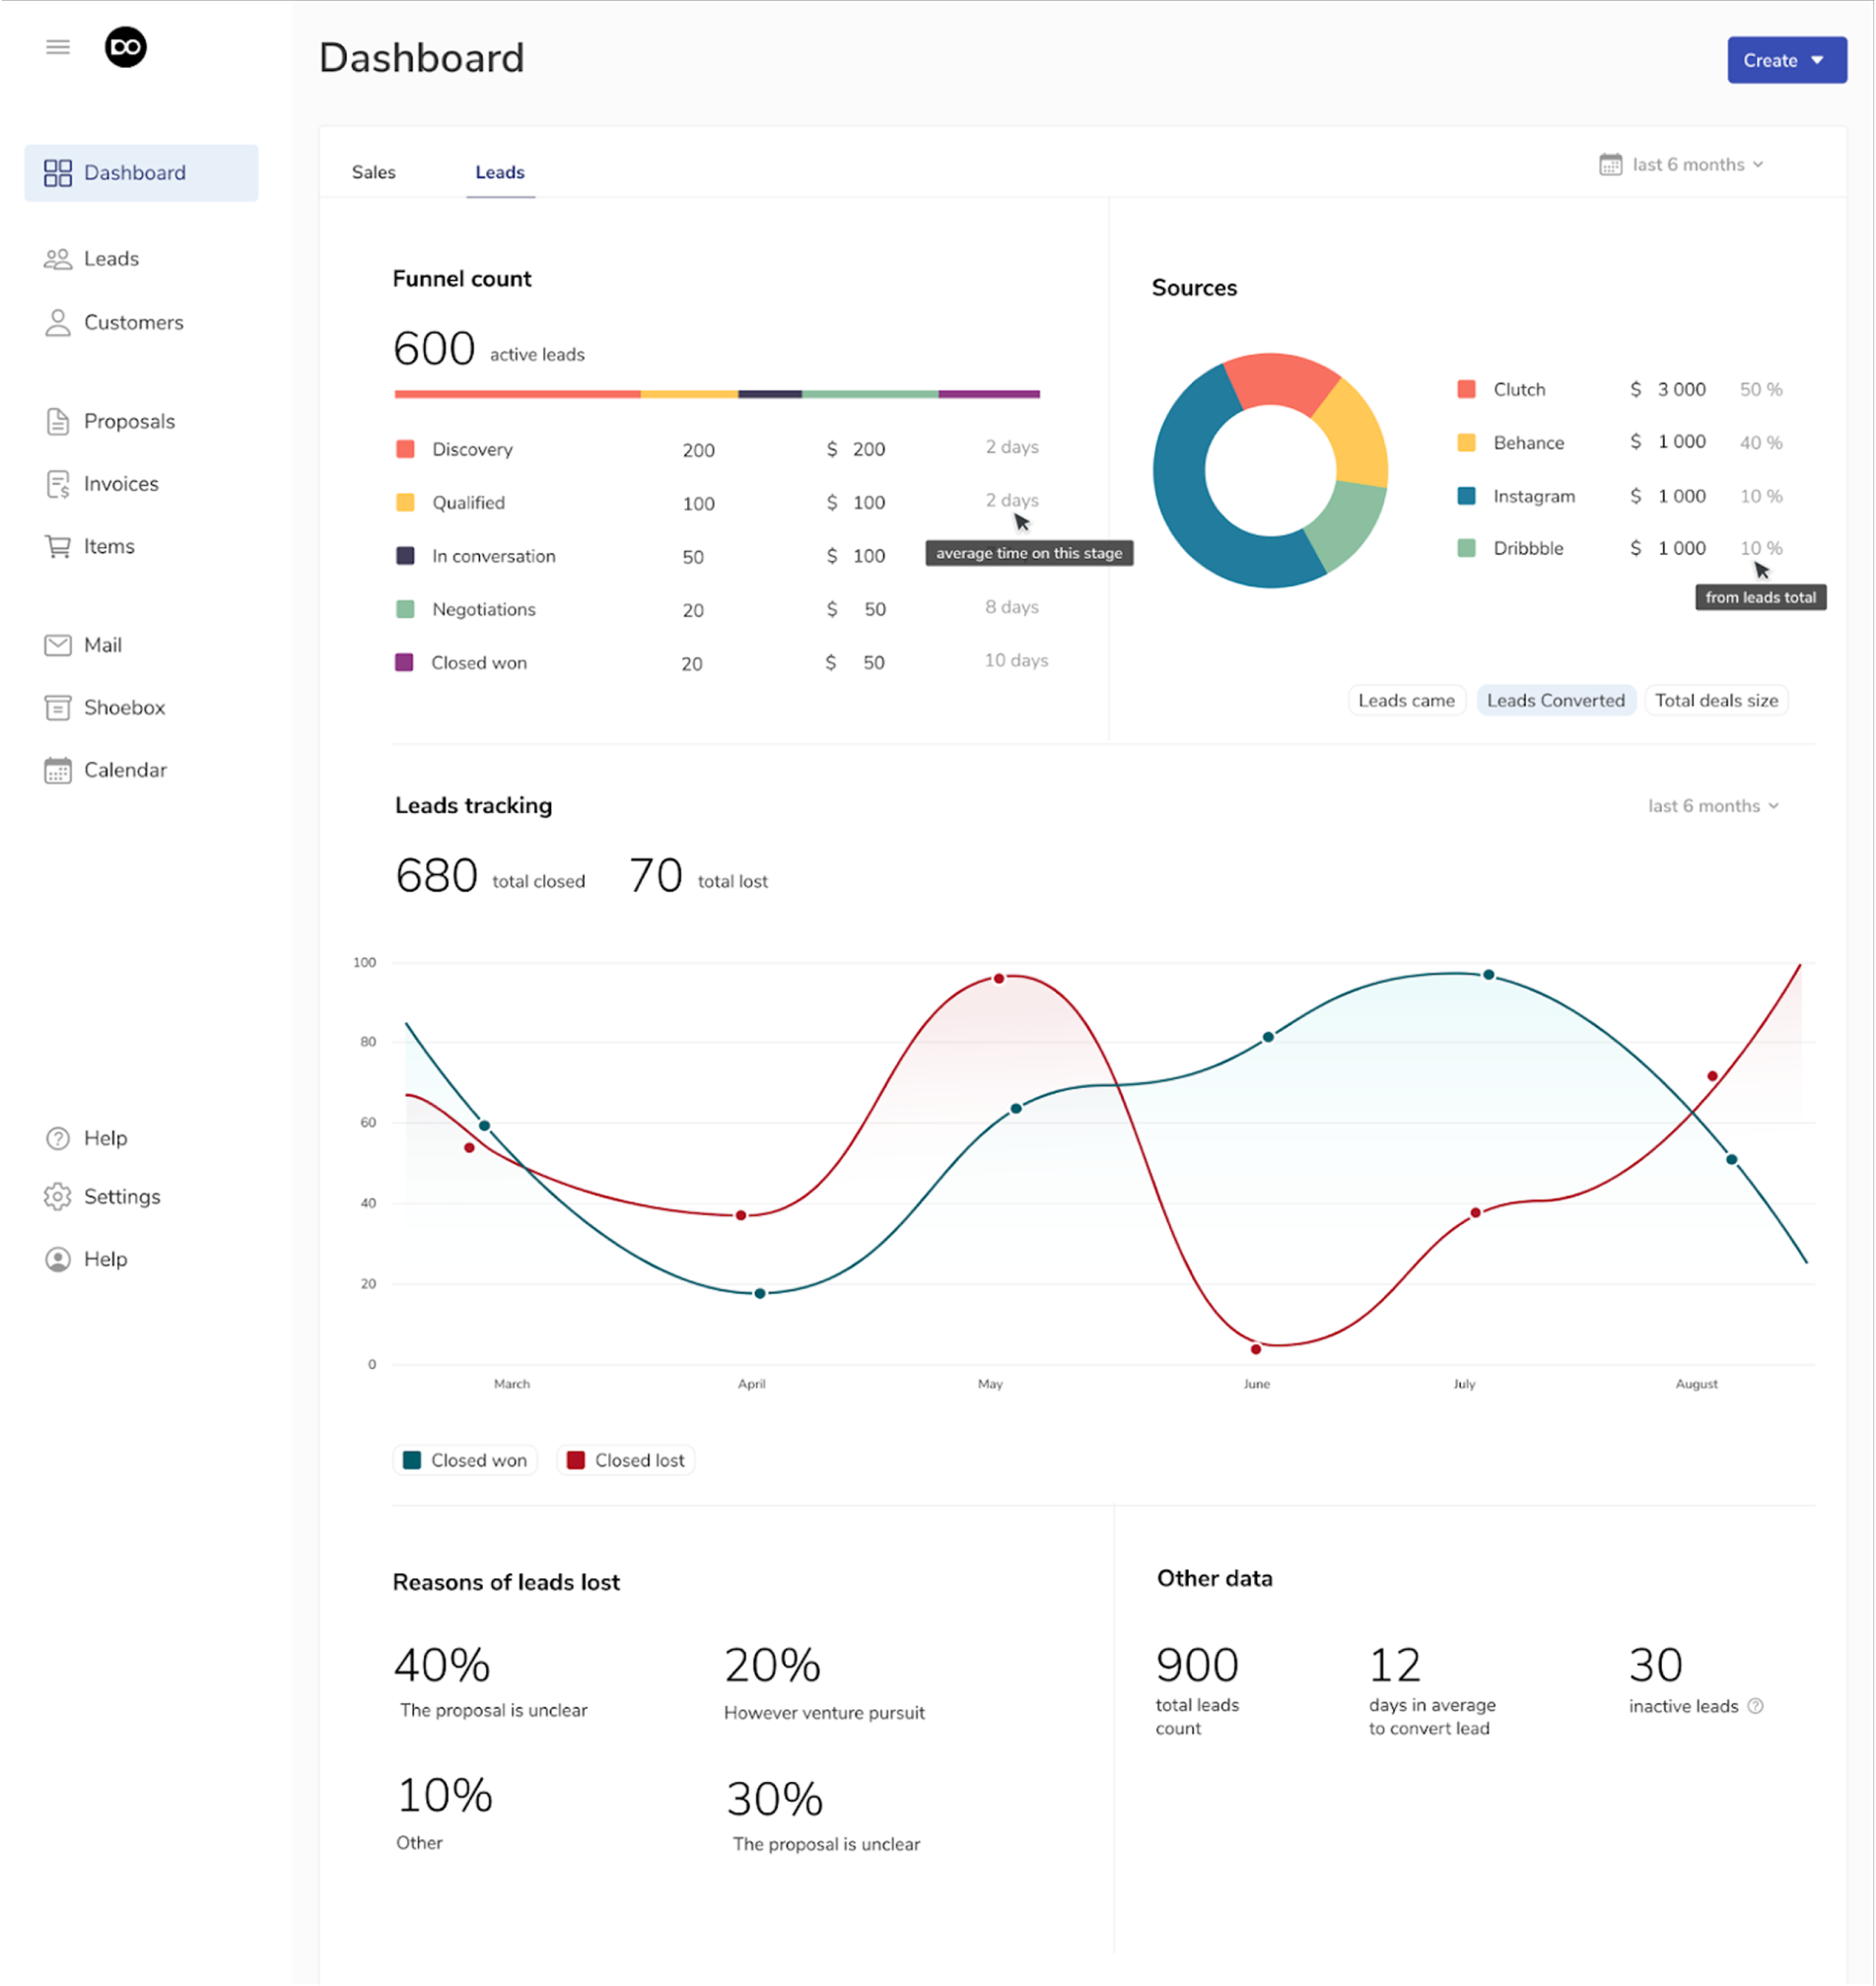
Example of KPI visualization with multiple chart types for clear trend tracking
Instead of drowning users in color chaos, the designers used just a few contrasting tones — blue, yellow, red, and green — to keep the interface clear and calm. Each chart tells its own story while fitting into one cohesive visual language.
So, the takeaway? Different data deserves different visuals. Tables give you details. Cards give you focus. Charts give you meaning. And when you strike the right balance between them, your dashboard stops being just a wall of data — it becomes a tool for insight.
Dashboard design inspiration sources
And let’s be honest, even the greatest designers need inspiration. But dashboards aren’t like mood boards on Pinterest. You need examples that actually work, not just look good.
So a good place to start is Dribbble, where designers constantly share creative layouts and dashboard concepts. Just remember, many of those shots are made for show, not for use. So treat them as a spark of your initial idea, not a template.
And for more grounded inspiration, check out Eleken’s case studies. We’ve designed dashboards for products across dozens of industries — from logistics and finance to AI and analytics — each built to solve real user problems.
We bring those best practices into every project we take on. For instance, our redesign for Aampe, an AI-driven marketing platform, helped the company streamline its performance dashboards and eventually raise $18M in funding.
What to look for in a design partner for AI dashboards
If you’ve made it this far, you’re officially a hero. That was a lot of information to take on.
And at this point, you might be thinking: “Okay, cool, but what should I actually look for in a designer or agency if I want to build something like this?”.
After working on dozens of analytics dashboards for SaaS teams across industries, here’s what really matters when choosing the right design partner:
- Familiarity with AI and data tools
A good dashboard designer understands where the data comes from and how people use it. They know how to work with APIs, integrate AI copilots, and shape information so it’s not just accurate, but meaningful. It’s less about visuals and more about knowing how to translate raw data into something people instantly understand. - Experience in SaaS UX
Building dashboards for SaaS teams means balancing the needs of different roles — from product managers to end users. Someone with solid SaaS experience will know how to create layouts that adapt to filters, permissions, and data layers without turning the interface into a maze. - Understanding of function, not just form
Strong design goes beyond surface polish. Every color, label, and chart placement should have a reason. The right partner digs into the purpose behind each metric — what decision it supports, and how to make that decision easier to act on. - Ability to work with dev and BI teams
Dashboard design is rarely a solo effort. It works best when designers, developers, and BI specialists are in sync. Look for someone who can jump into shared tools, exchange feedback fast, and keep UX aligned with technical realities from day one.

At Eleken, we’ve been designing for SaaS for over a decade, helping companies turn complex data into clear, actionable insights. Our team blends product thinking with UI/UX craft, and we work seamlessly with tools you already use — from Luzmo and Supabase to Airtable, Retool, and GPT APIs.
If you’re looking for a partner who’s been there, done that, and still loves solving new design challenges — reach out to us. We’ll help you build dashboards that not only look great but actually work for your users.
Wrapping up
So at this point, we’ve covered quite a lot — from why dashboards fail and how AI fits in, to tools, workflows, and real-world design examples. Hopefully, you’re walking away with a clearer sense of how to turn all that data into something people actually enjoy using.
You can build dashboards faster than ever with AI, but it’s the design that makes them great.
Speed means nothing if the end result leaves people guessing. The difference between a “meh” dashboard and one that truly drives action lies in thoughtful UX, clear hierarchy, and knowing what your users actually need to see.
At Eleken, we’ve spent years helping SaaS teams turn rough AI outputs into polished, decision-ready dashboards. So whether you’re starting with a GPT-generated wireframe or scaling a complex analytics product, we can help you build dashboards that not only look good but also feel seamless to use.


.webp)

.png)

.png)