Process Enablement Platform
Turning vision into investor-ready prototype for a process enablement platform
Our client is an up-and-coming startup that offers enterprise workflow automation. Seeing both process design and execution from within, they noticed that processes that seemed well-established and structured led to frustration. So they asked themself: “Why were even well-organized functions with highly harmonized processes not reaching their full potential in process execution?” Here was the moment our client came up with an idea for a new solution.
Process Enablement Platform is a new B2B SaaS solution for large enterprises with at least 5K employees that brings together process design, instructions, training, and discussions under one roof, serving as an actual source of truth on all processes.

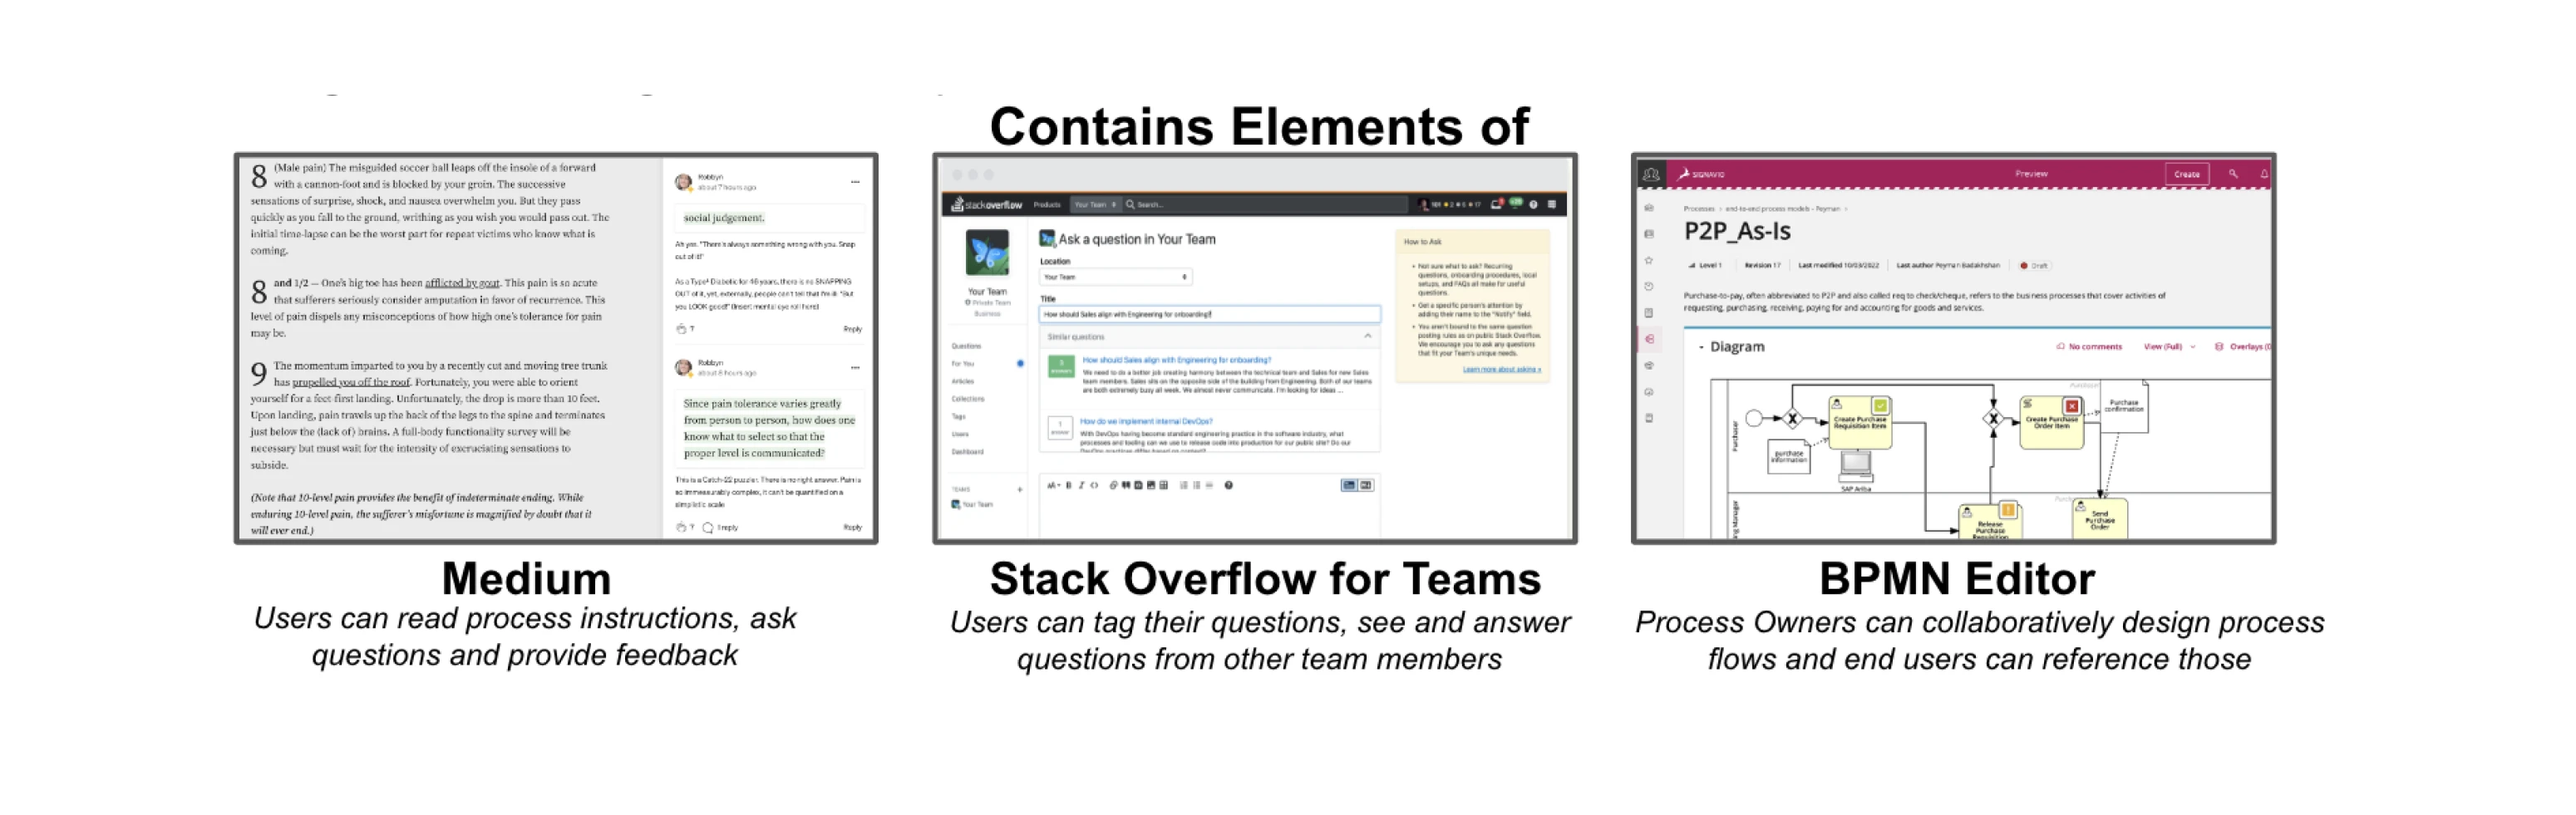
After brainstorming their product idea for more than several months our client came to understand why organizations do not reach their full potential for process efficiency. This happens because BPMN flow charts, instruction documents, training materials, and conversations about process execution are not bundled.
To address this and other challenges, our client wanted to create a solution that would allow users to:
- Access required information and work instructions using a well-structured and clear Processes page.
- Ask questions and provide feedback directly related to these work instructions that are visible to everyone.
- Design process flowcharts and store existing flowcharts (BPMN).
- Generate training materials for processes.
- View upcoming events like training, process updates, and recent discussions on process topics from the end-user starting page.
At first, they tried to develop wireframes on their own to be able to show them to potential co-founders and investors.
But the challenge was that our client didn’t have enough expertise in design to bring the vision to life. Luckily, Eleken designers were the right experts in creating early versions of any type of SaaS product.
Eleken’s UI/UX designer joins the project to turn the client’s idea into reality
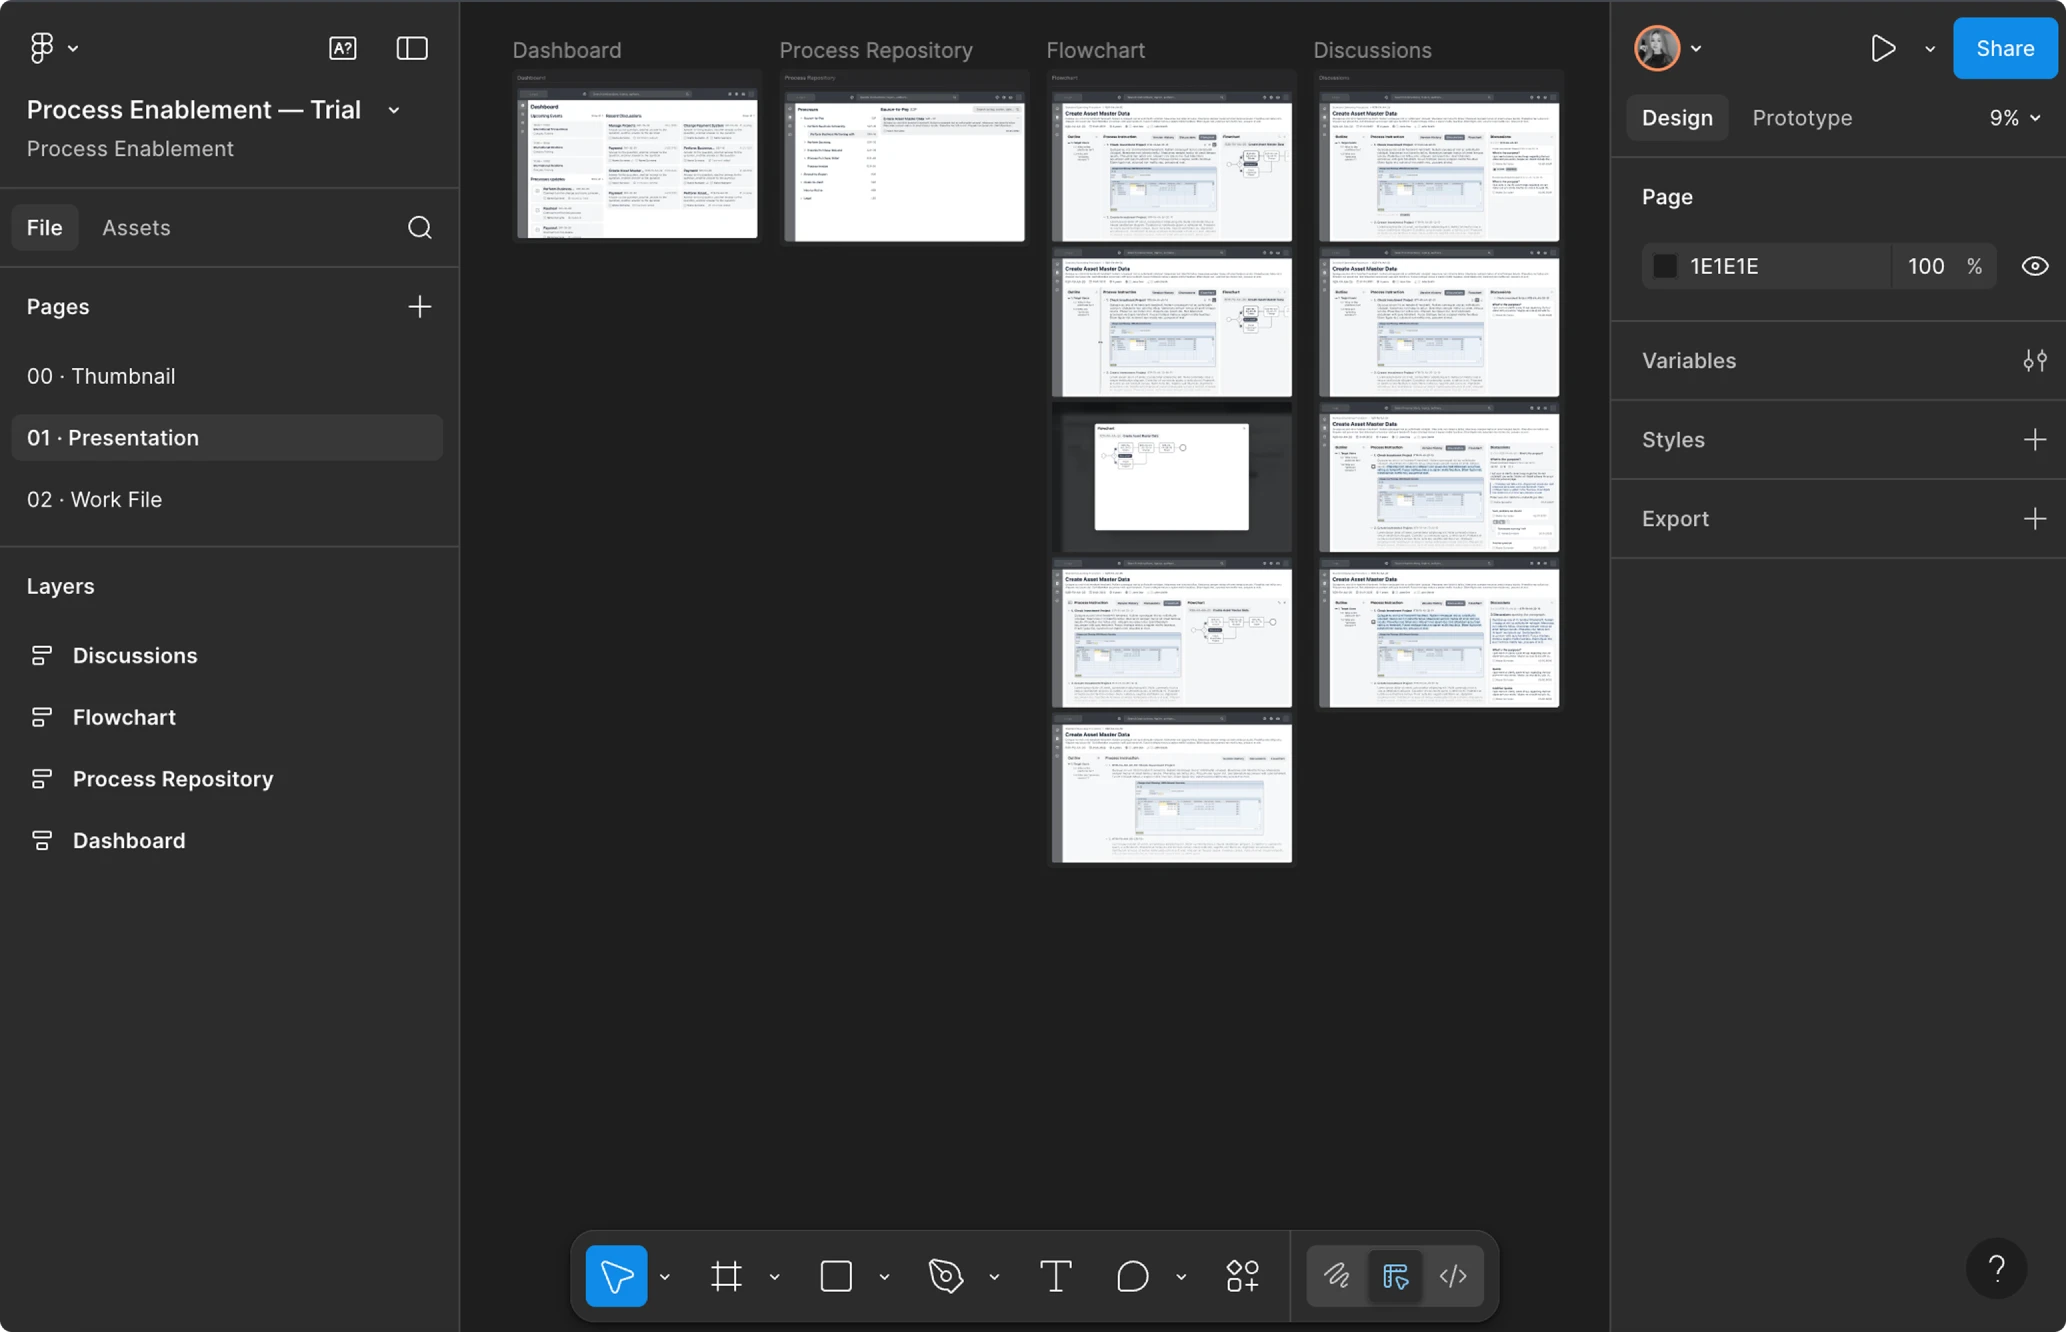
During a 3-day trial, our designer worked on improving the black-and-white high-fidelity wireframes created by the client. We made several variants of wireframes with different styles for the trial presentation. The designer presented ideas on how the Dashboard, Process Repository, Flowcharts, and Discussions sections may function and look:
The client was happy with the result, and active work began.
Here is what our collaboration looked like
As the design process moved on, we started to work on the platform's structure, logic, and new screens.
Additionally, he designed all the elements for the starting page of the end-user dashboard.
Here are some details on what we did.
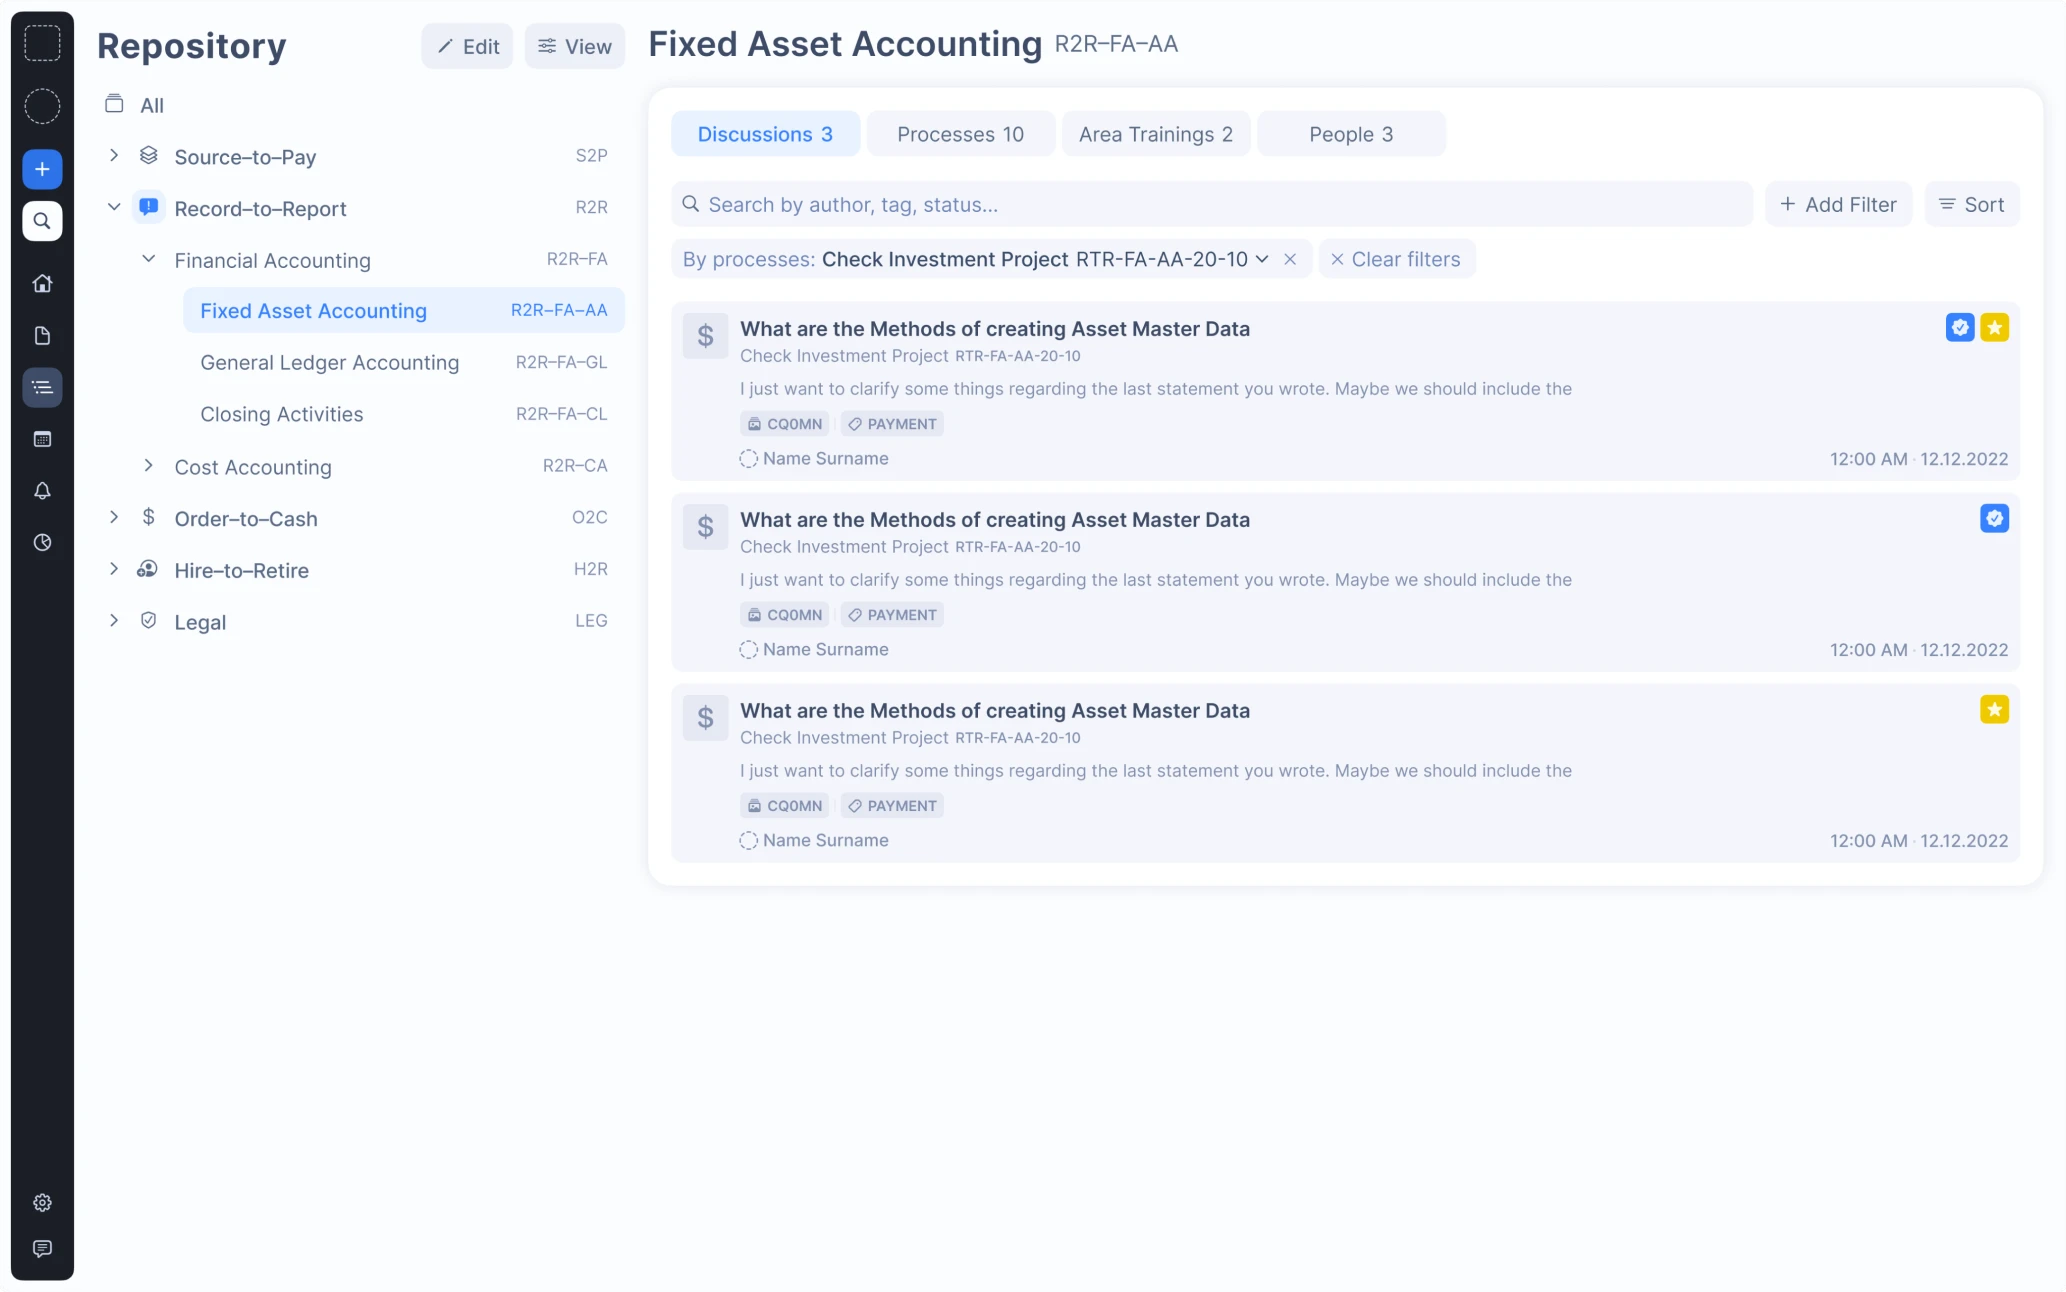
Step 1: Simplifying the structure inside the Process Repository page
Our team did their best to make the structure and navigation easy to understand and intuitive by implementing open tabs and section divisions. To help users access needed information about processes, we also added tags and icons that could be assigned either by users or the system.
The icons are correlated, allowing users to understand what category the process refers to. Every process name includes the tag with connected documentation and tag category, making it simple to find related processes.
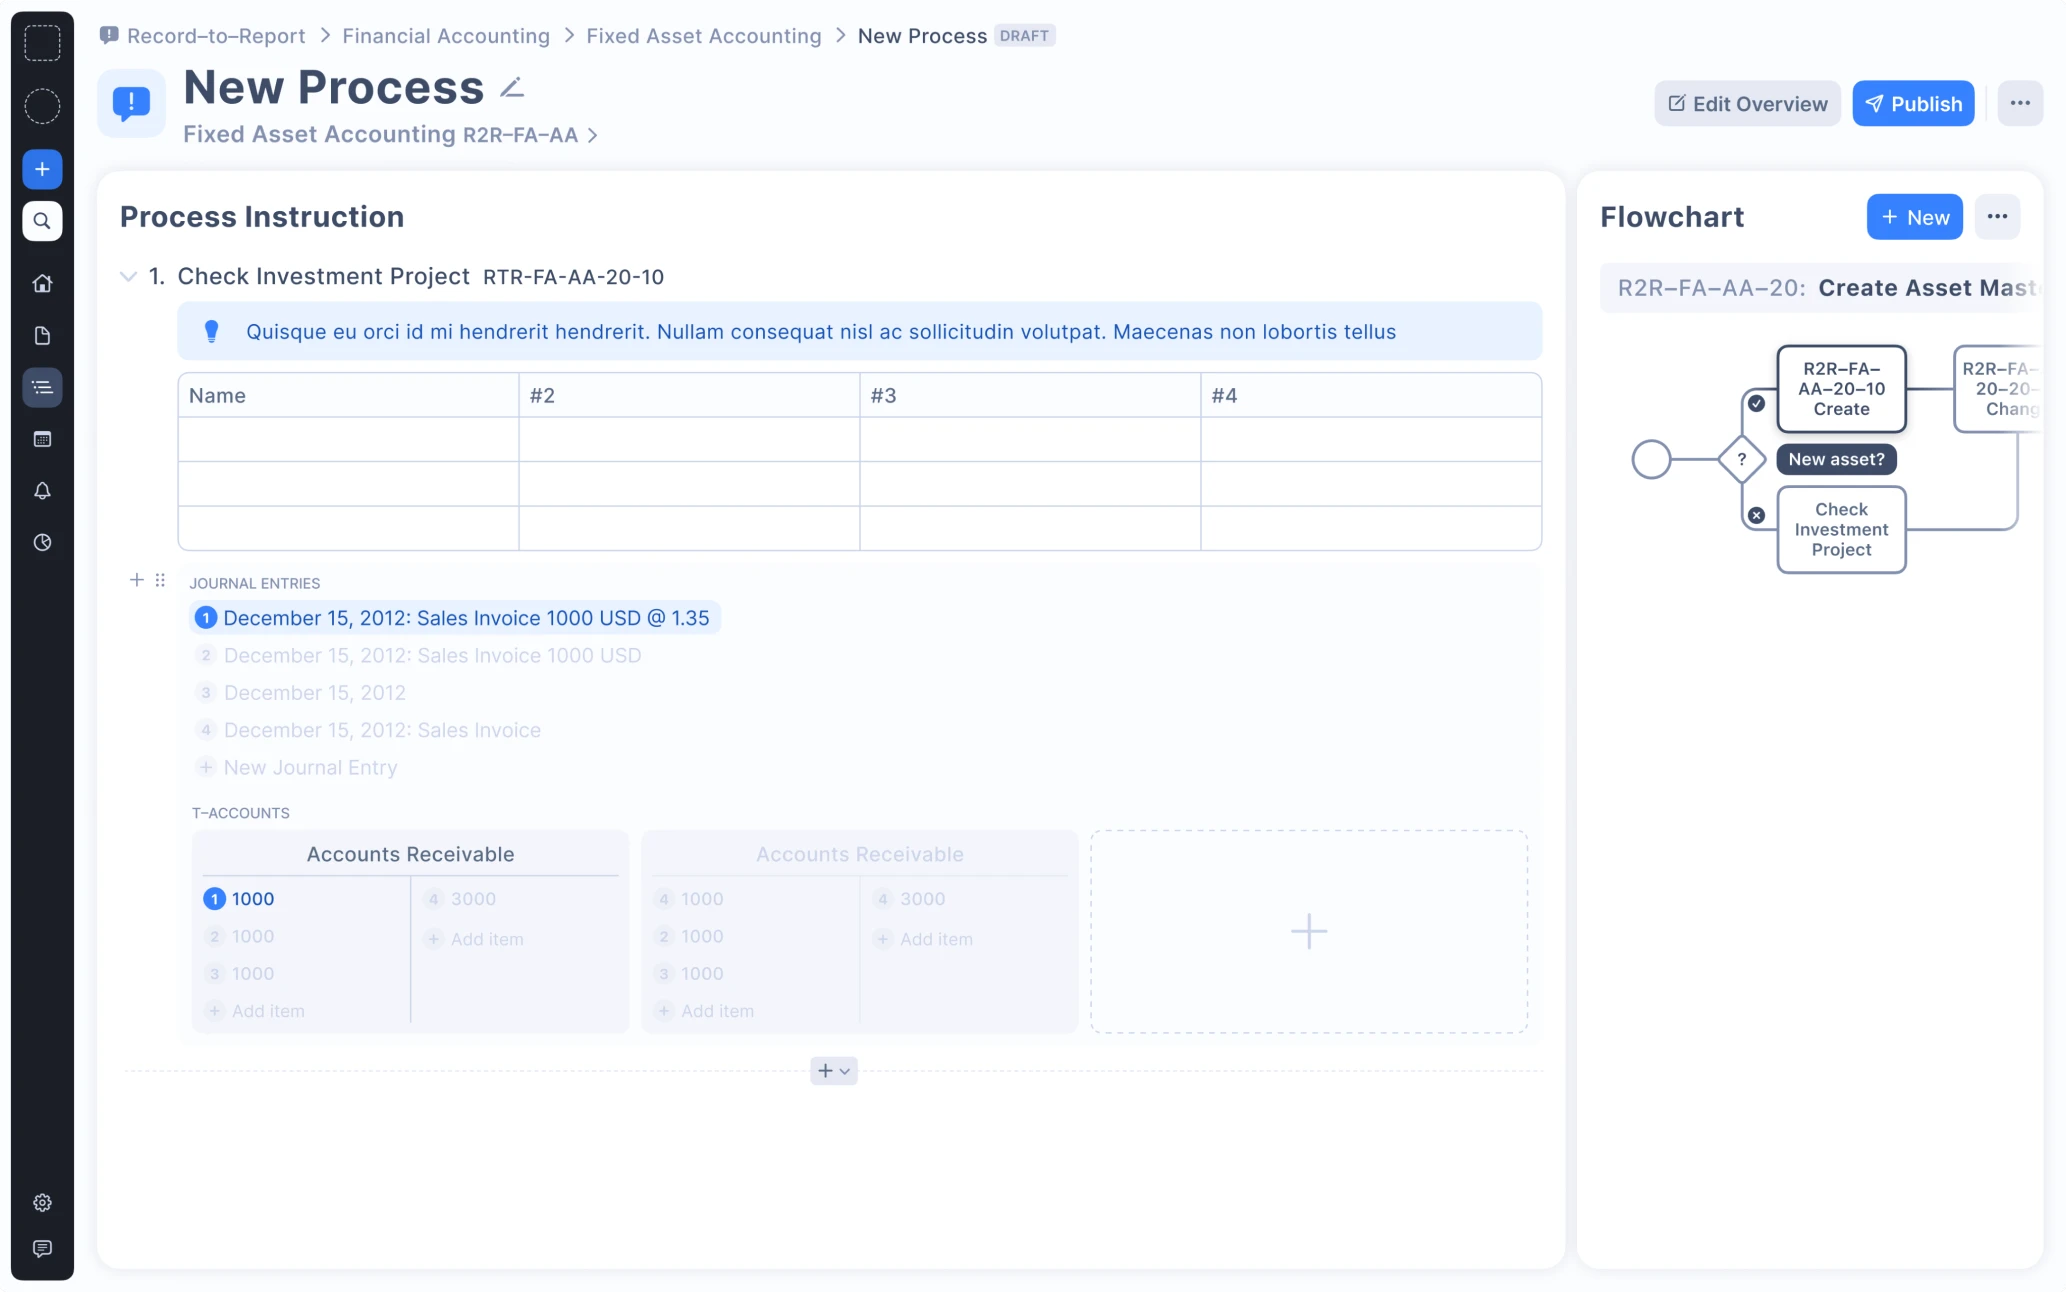
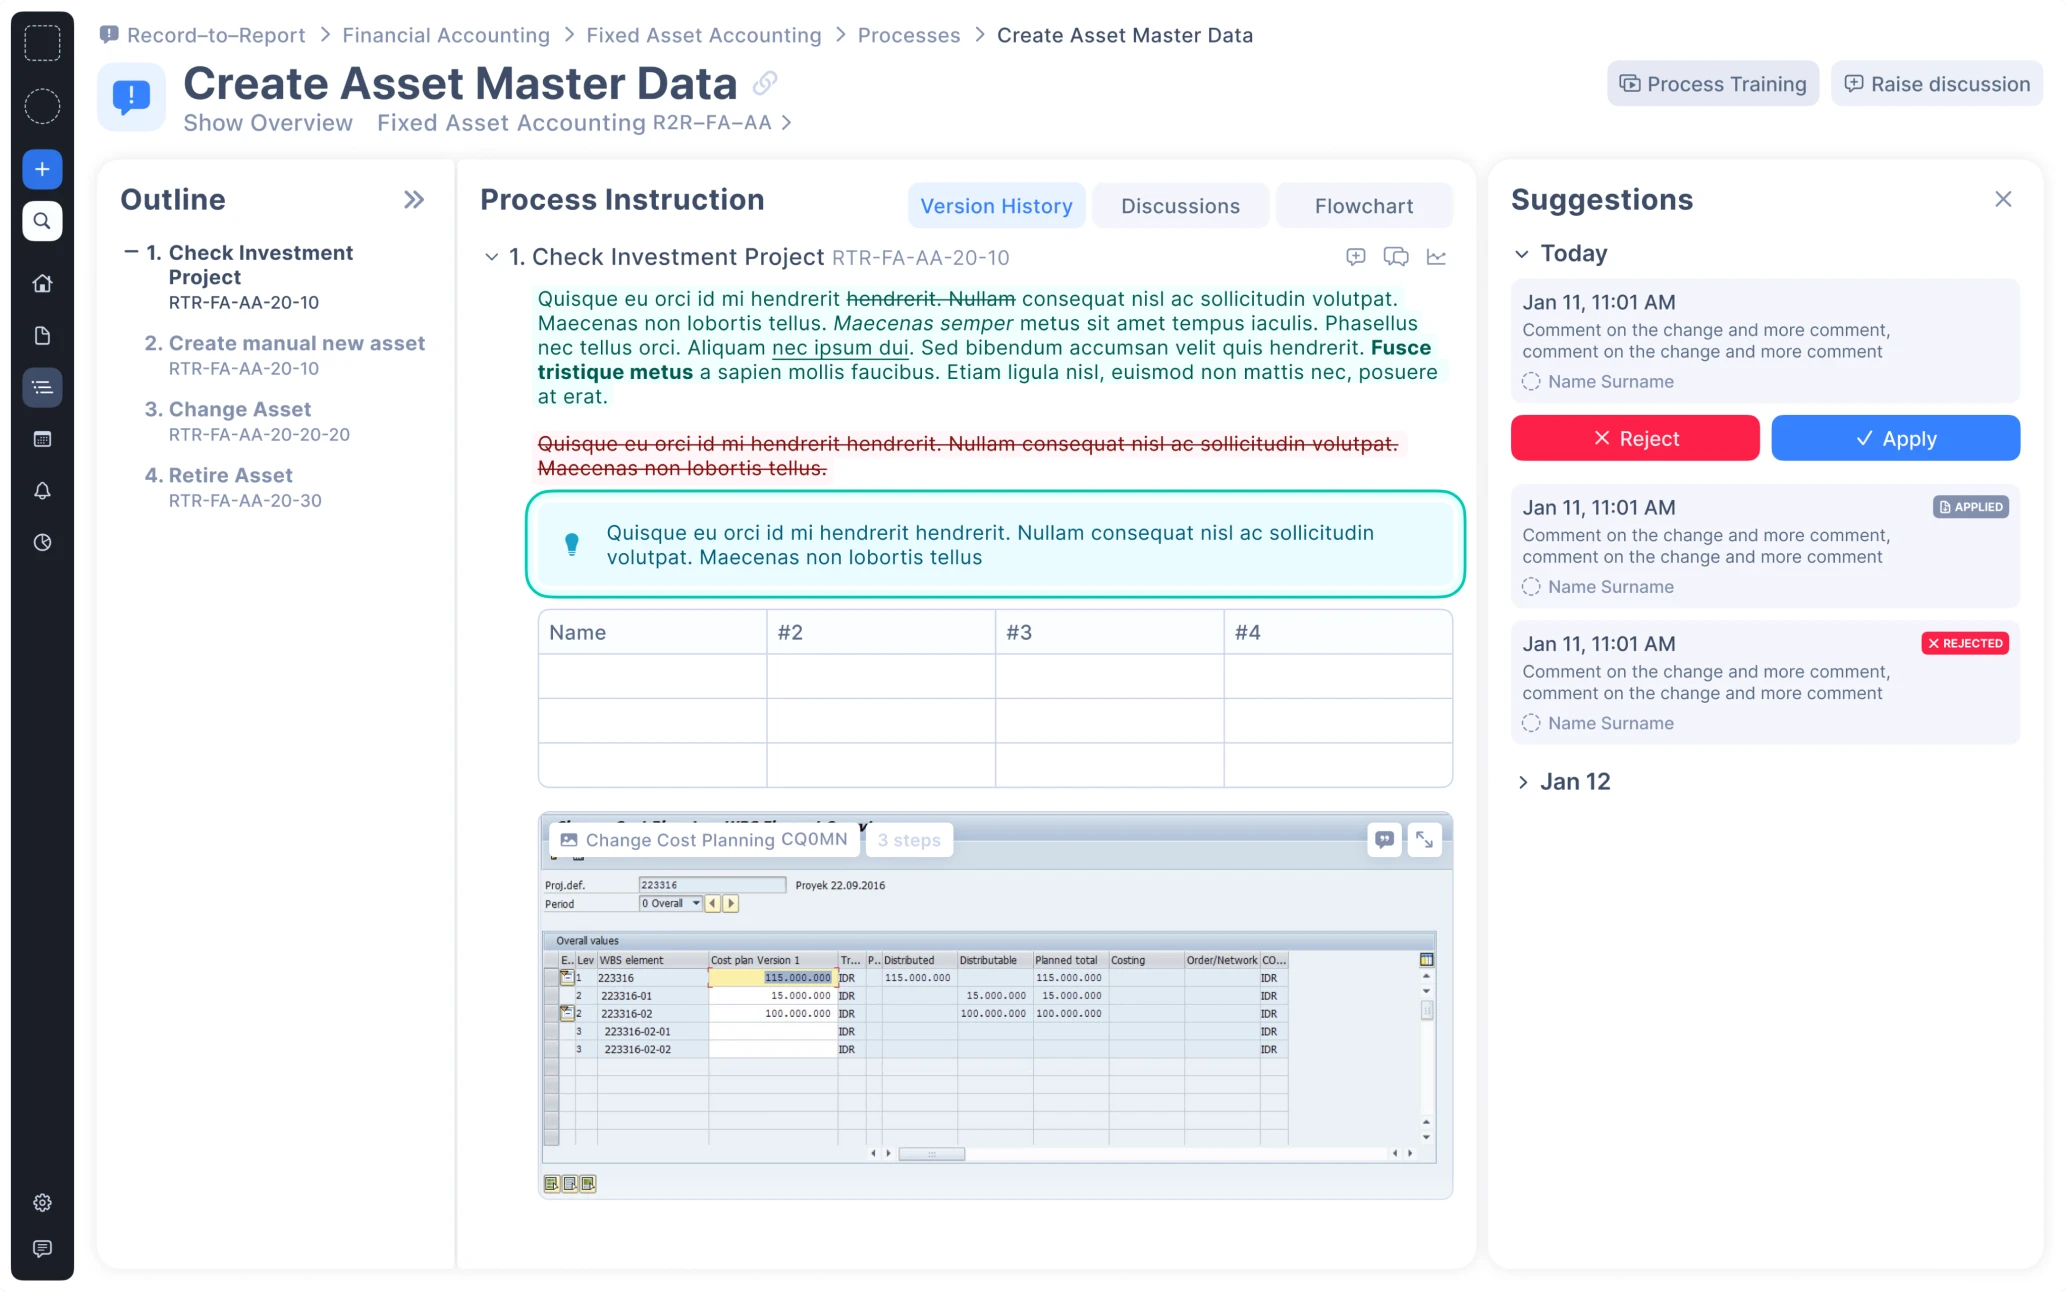
We also simplified the revision of the relationships between data. Our designer added statuses that represent the process and its data. All data is presented on the same page, so there is no need to switch tabs. Users can view changes and the version history within the page as well.
While brainstorming the product idea, our client noticed that process instructions usually include a lot of screenshots to show where to click or enter data, which resulted in user frustration. So our client was looking for a more creative approach to user onboarding.
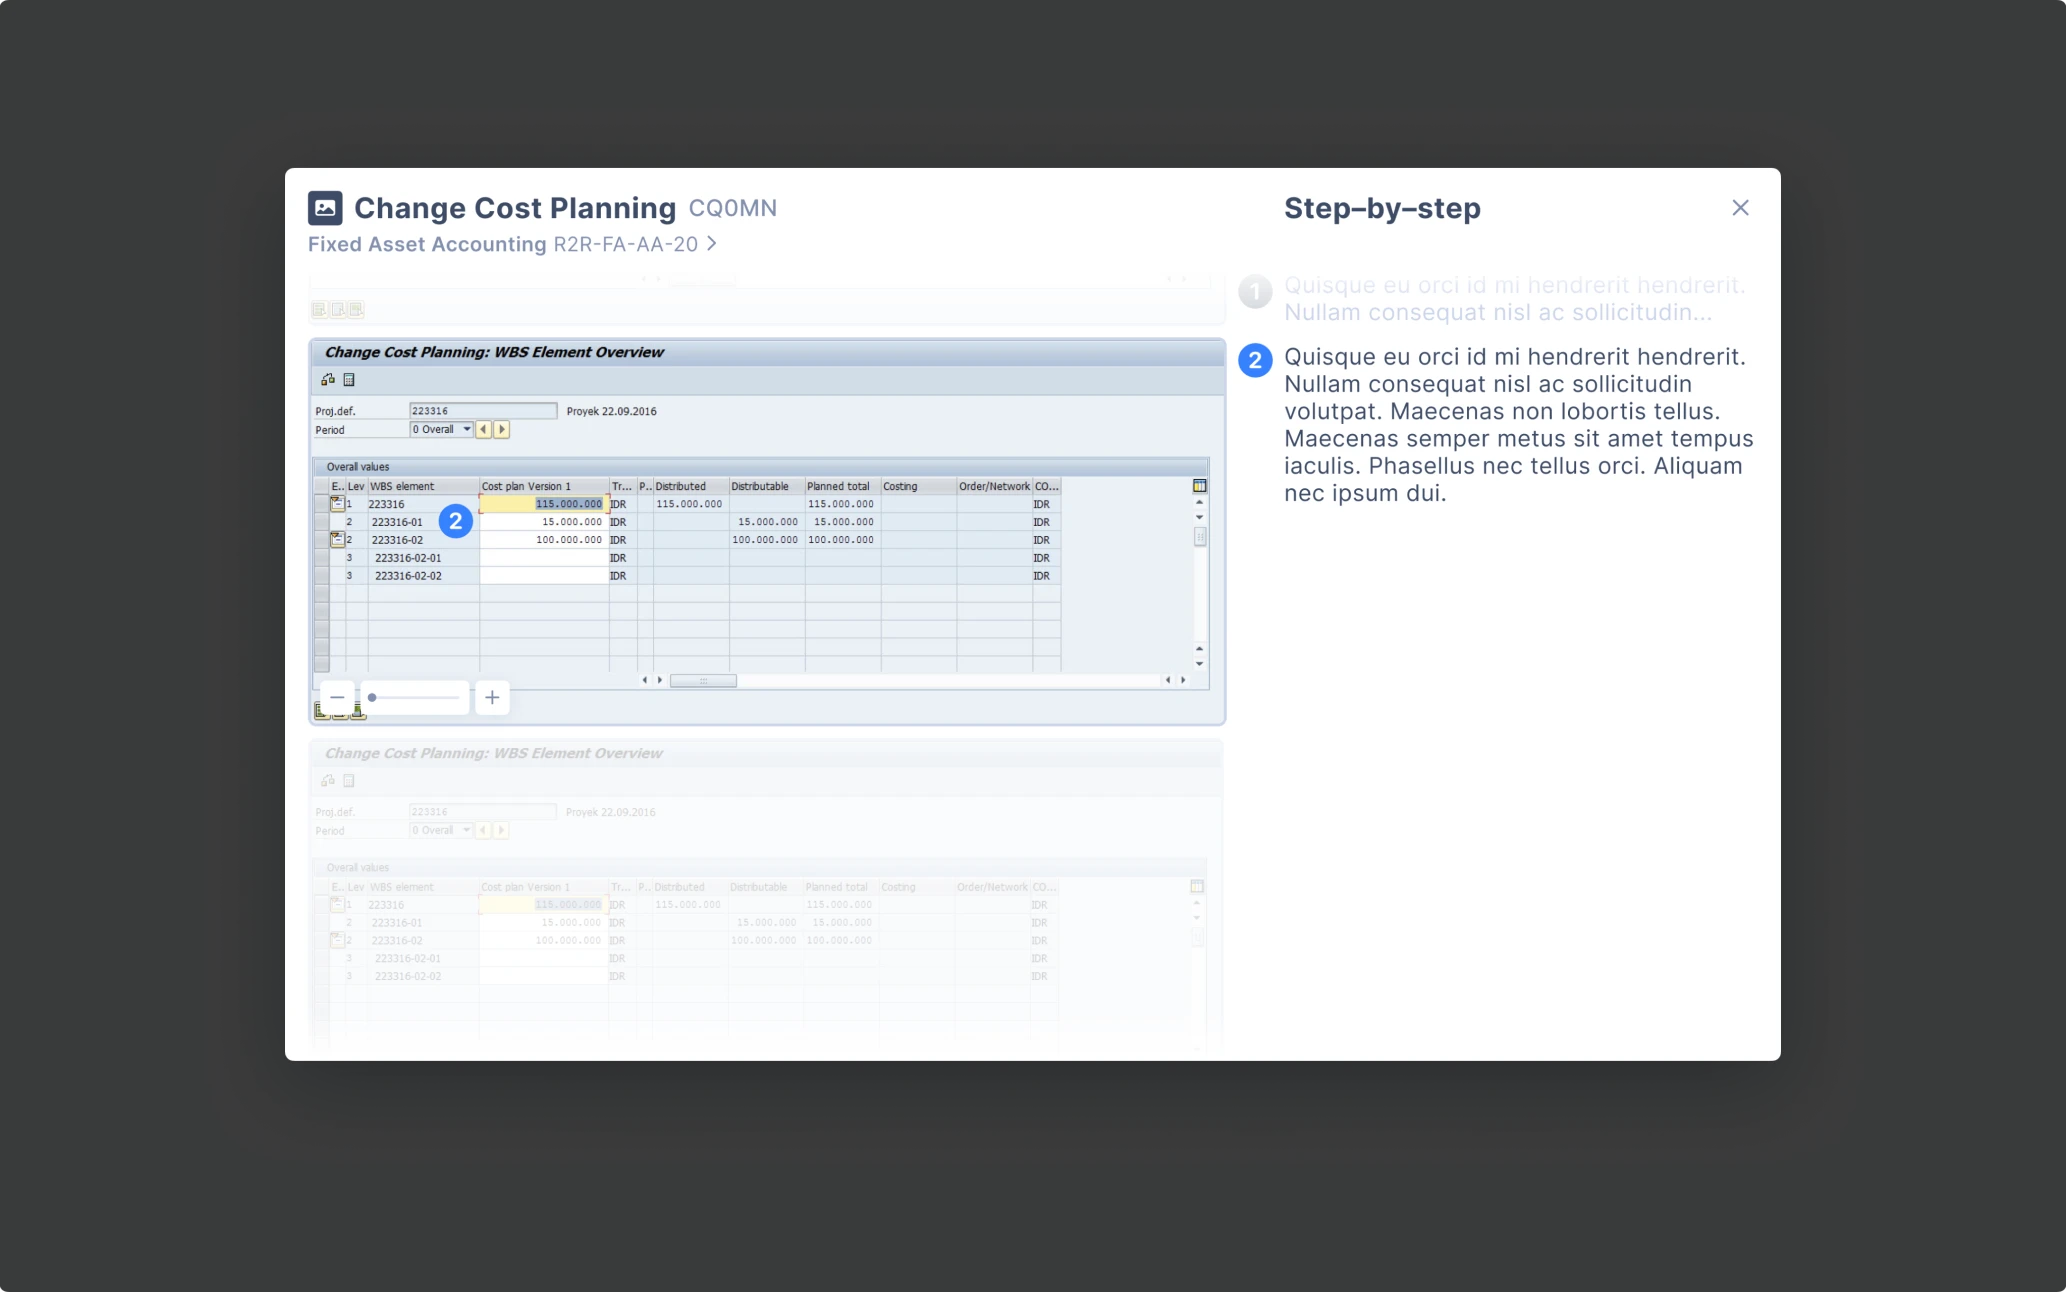
Following the client’s request, we added the Smart Screenshots functionality.
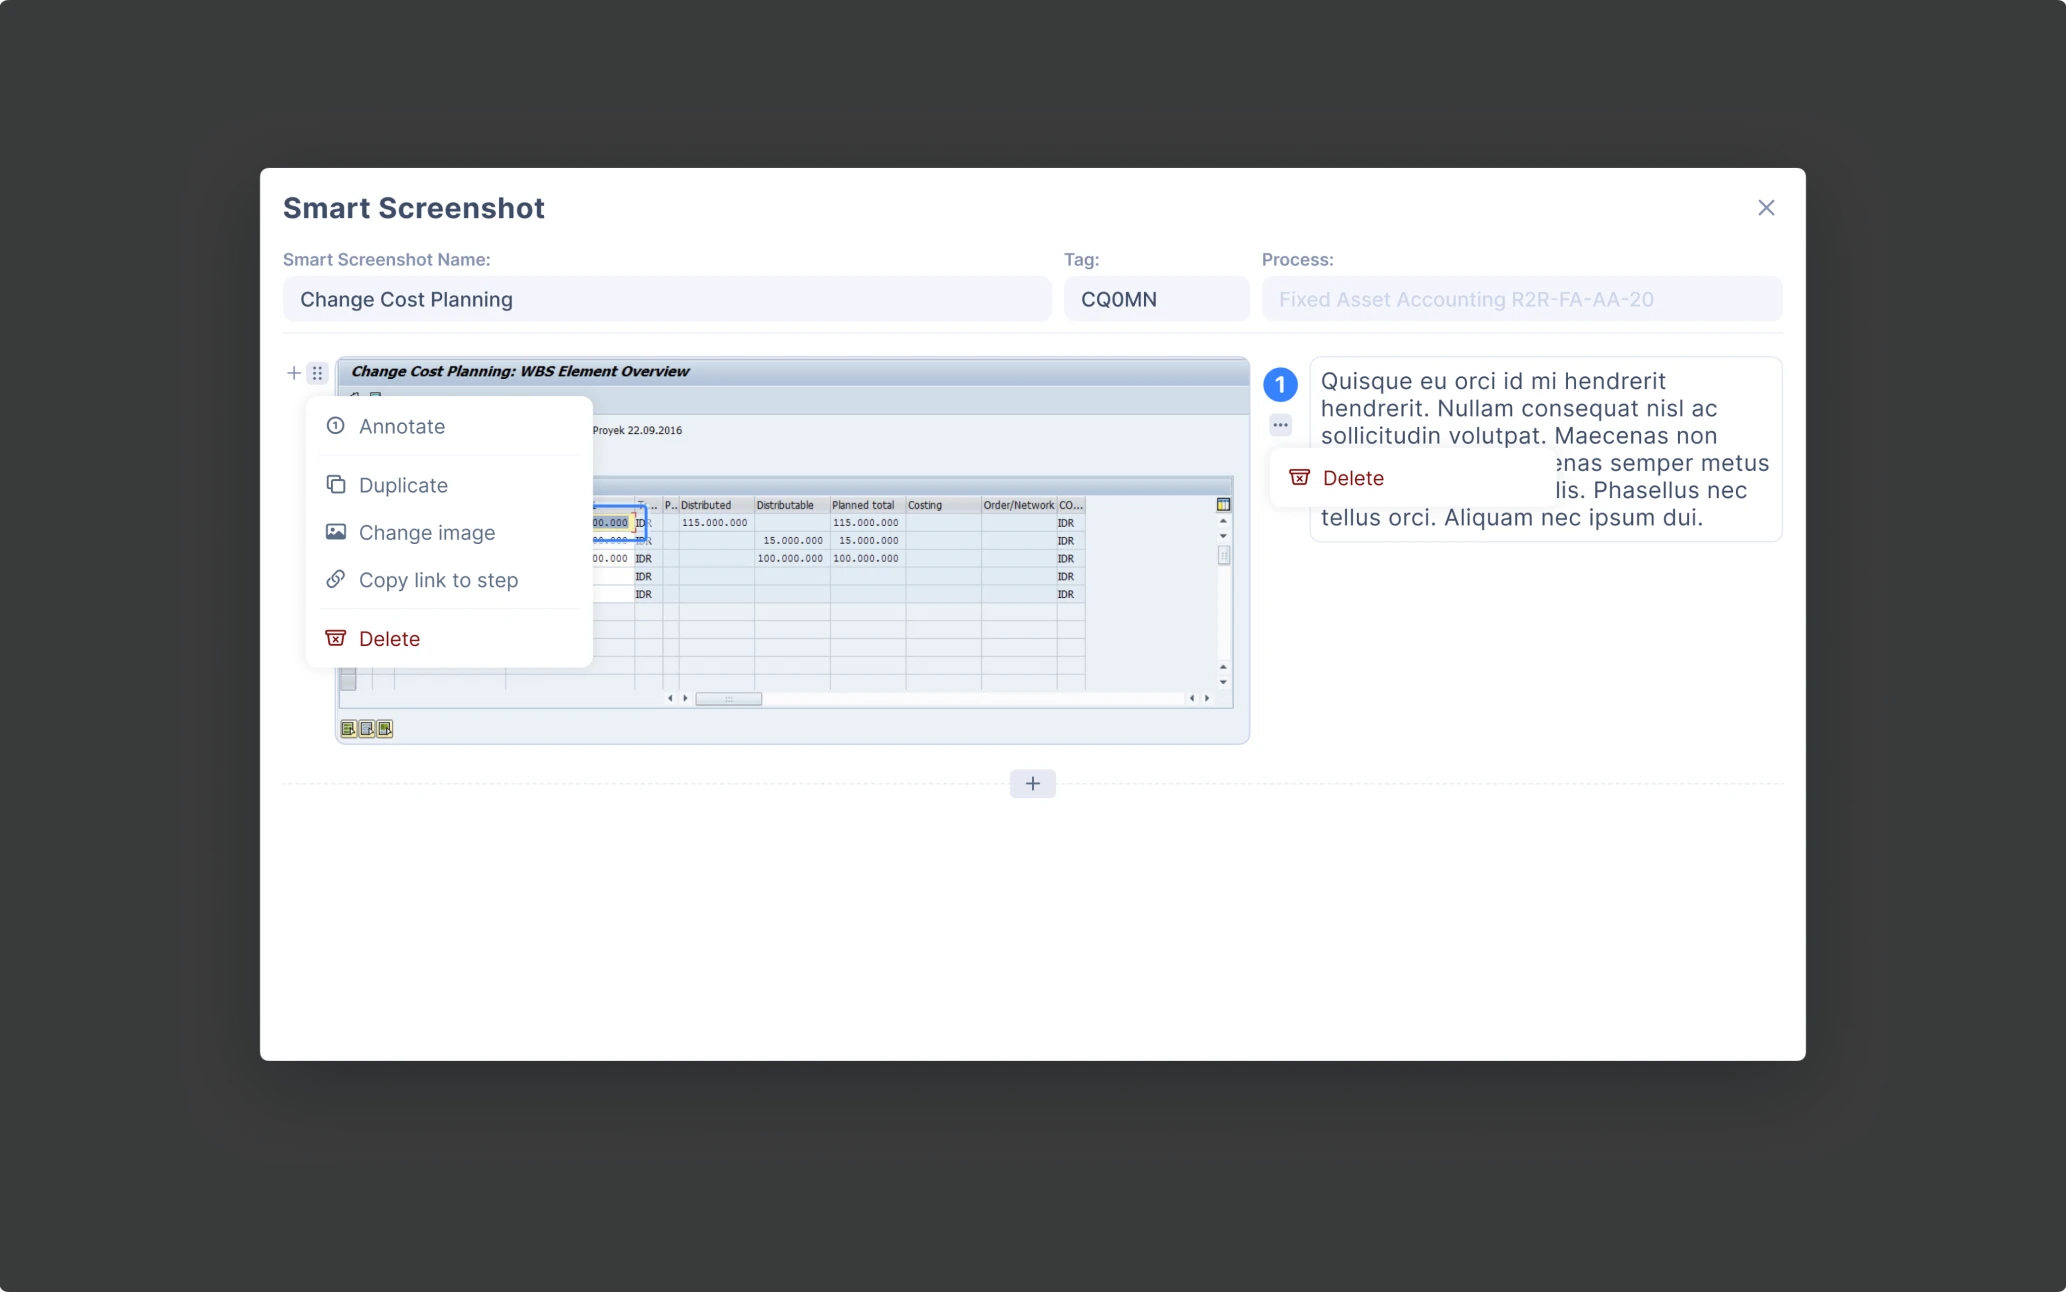
Now, instead of having 5 screenshots on 3 pages, the user can make one click, and a modal opens up. Then, the users are walked through all the relevant fields they need.
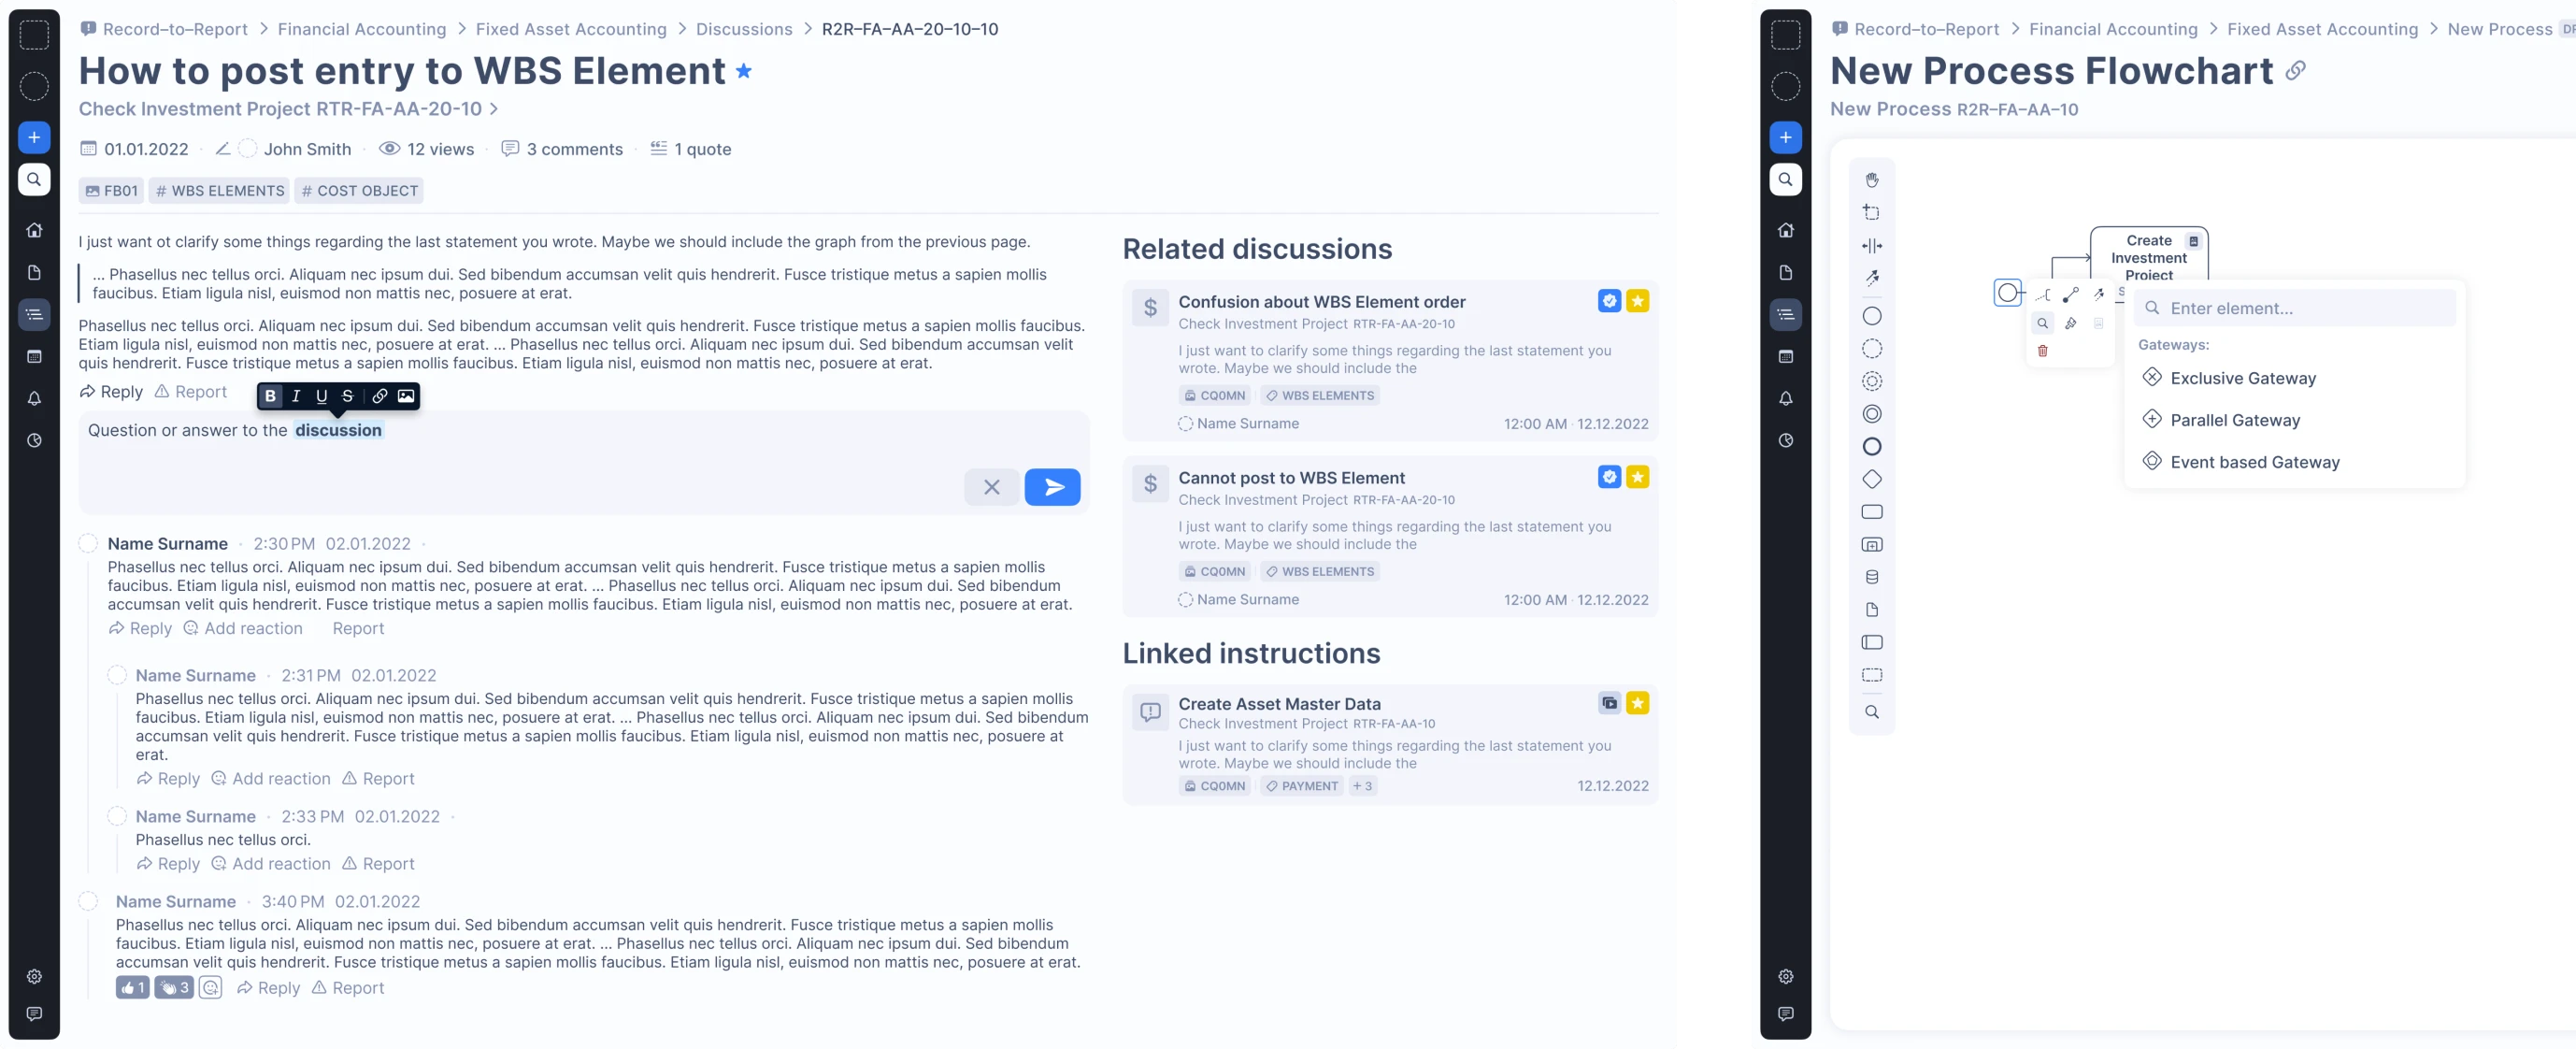
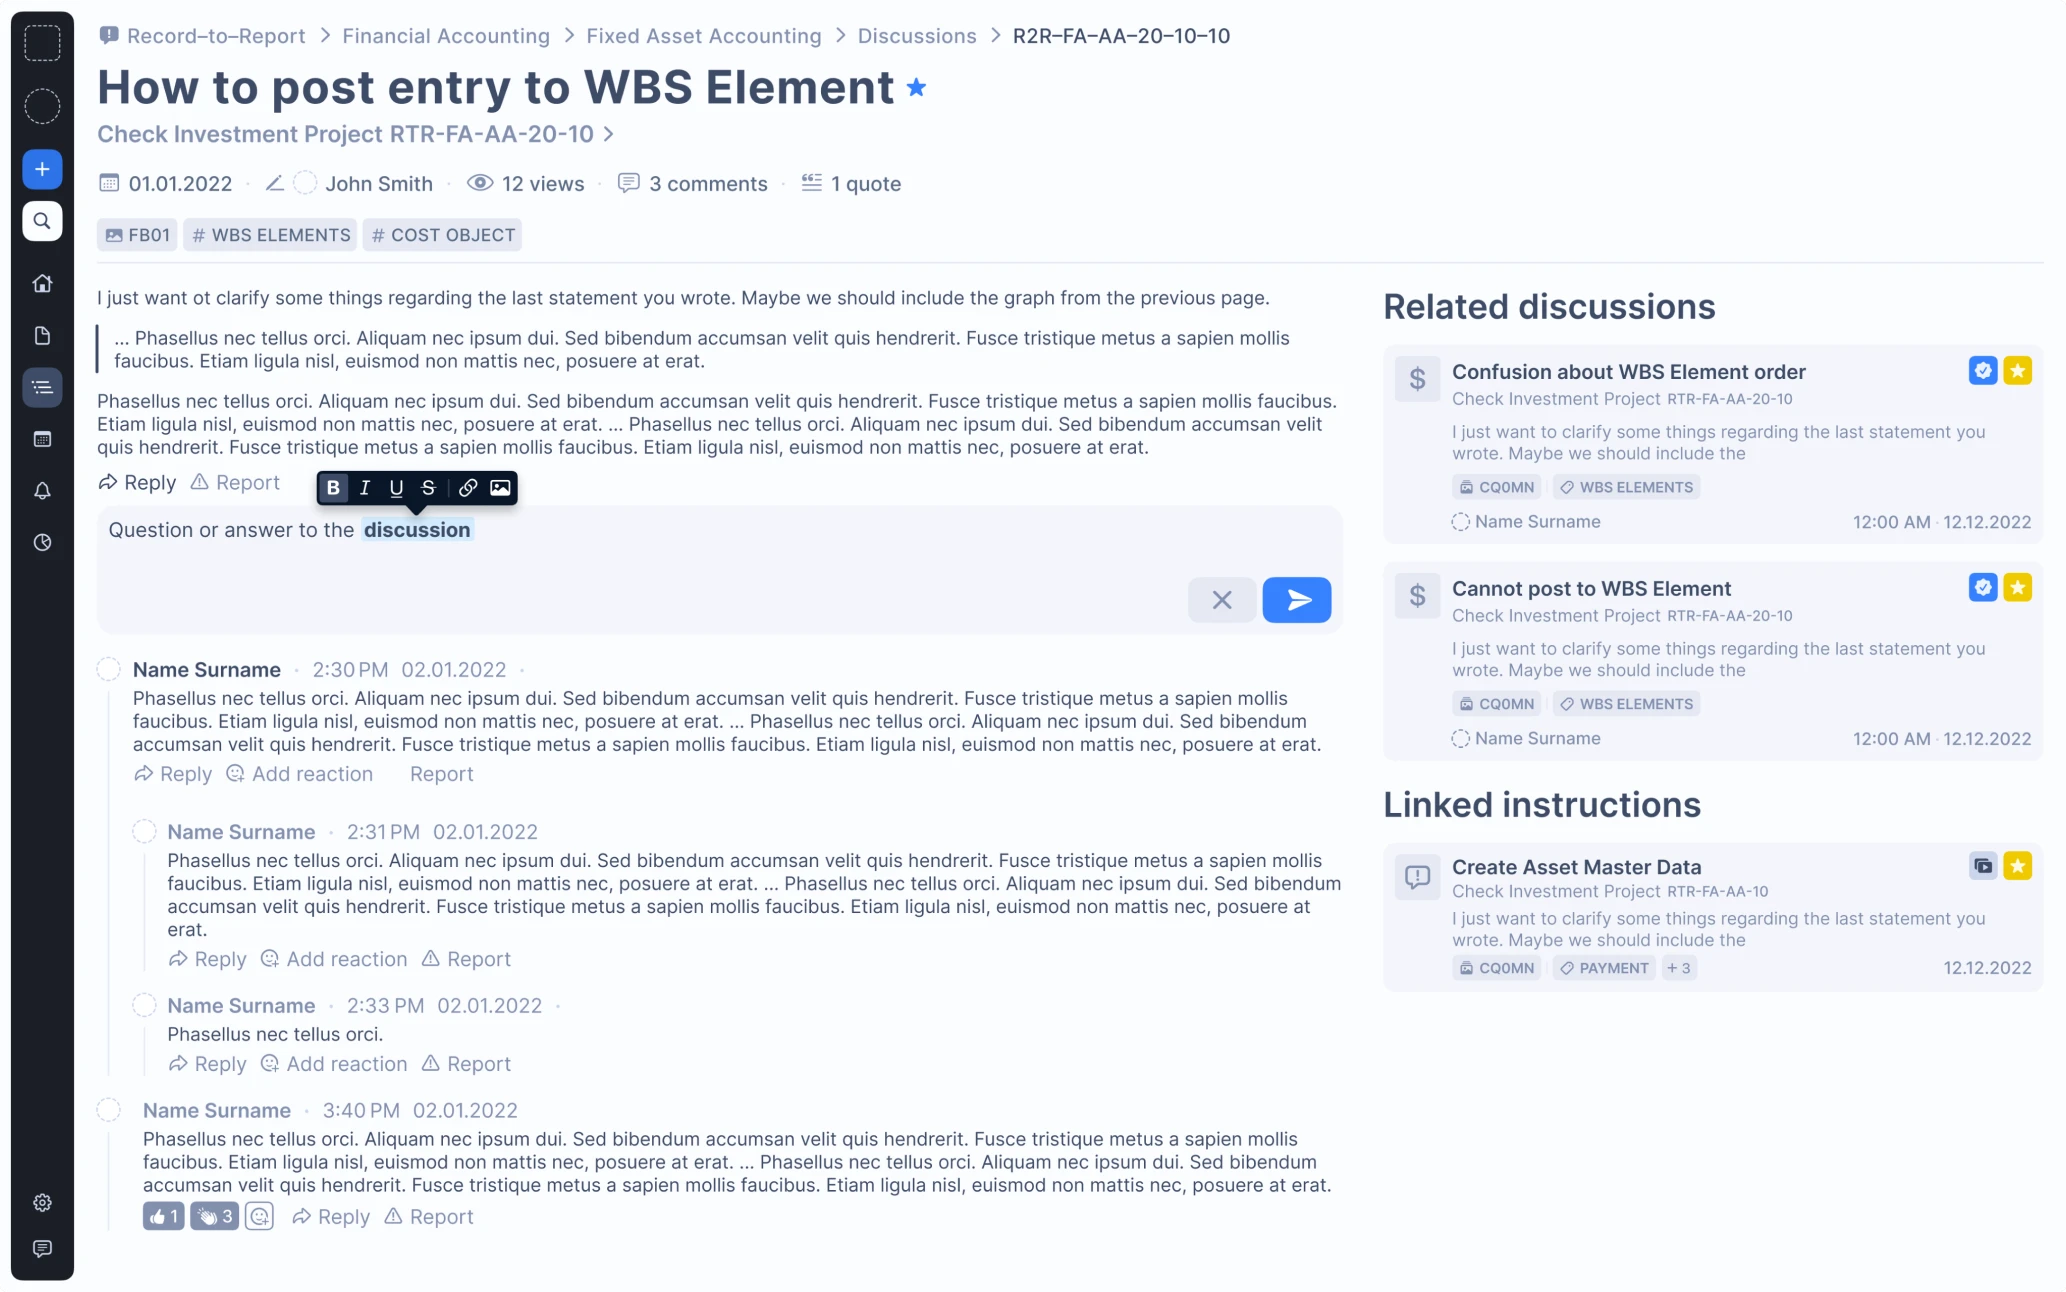
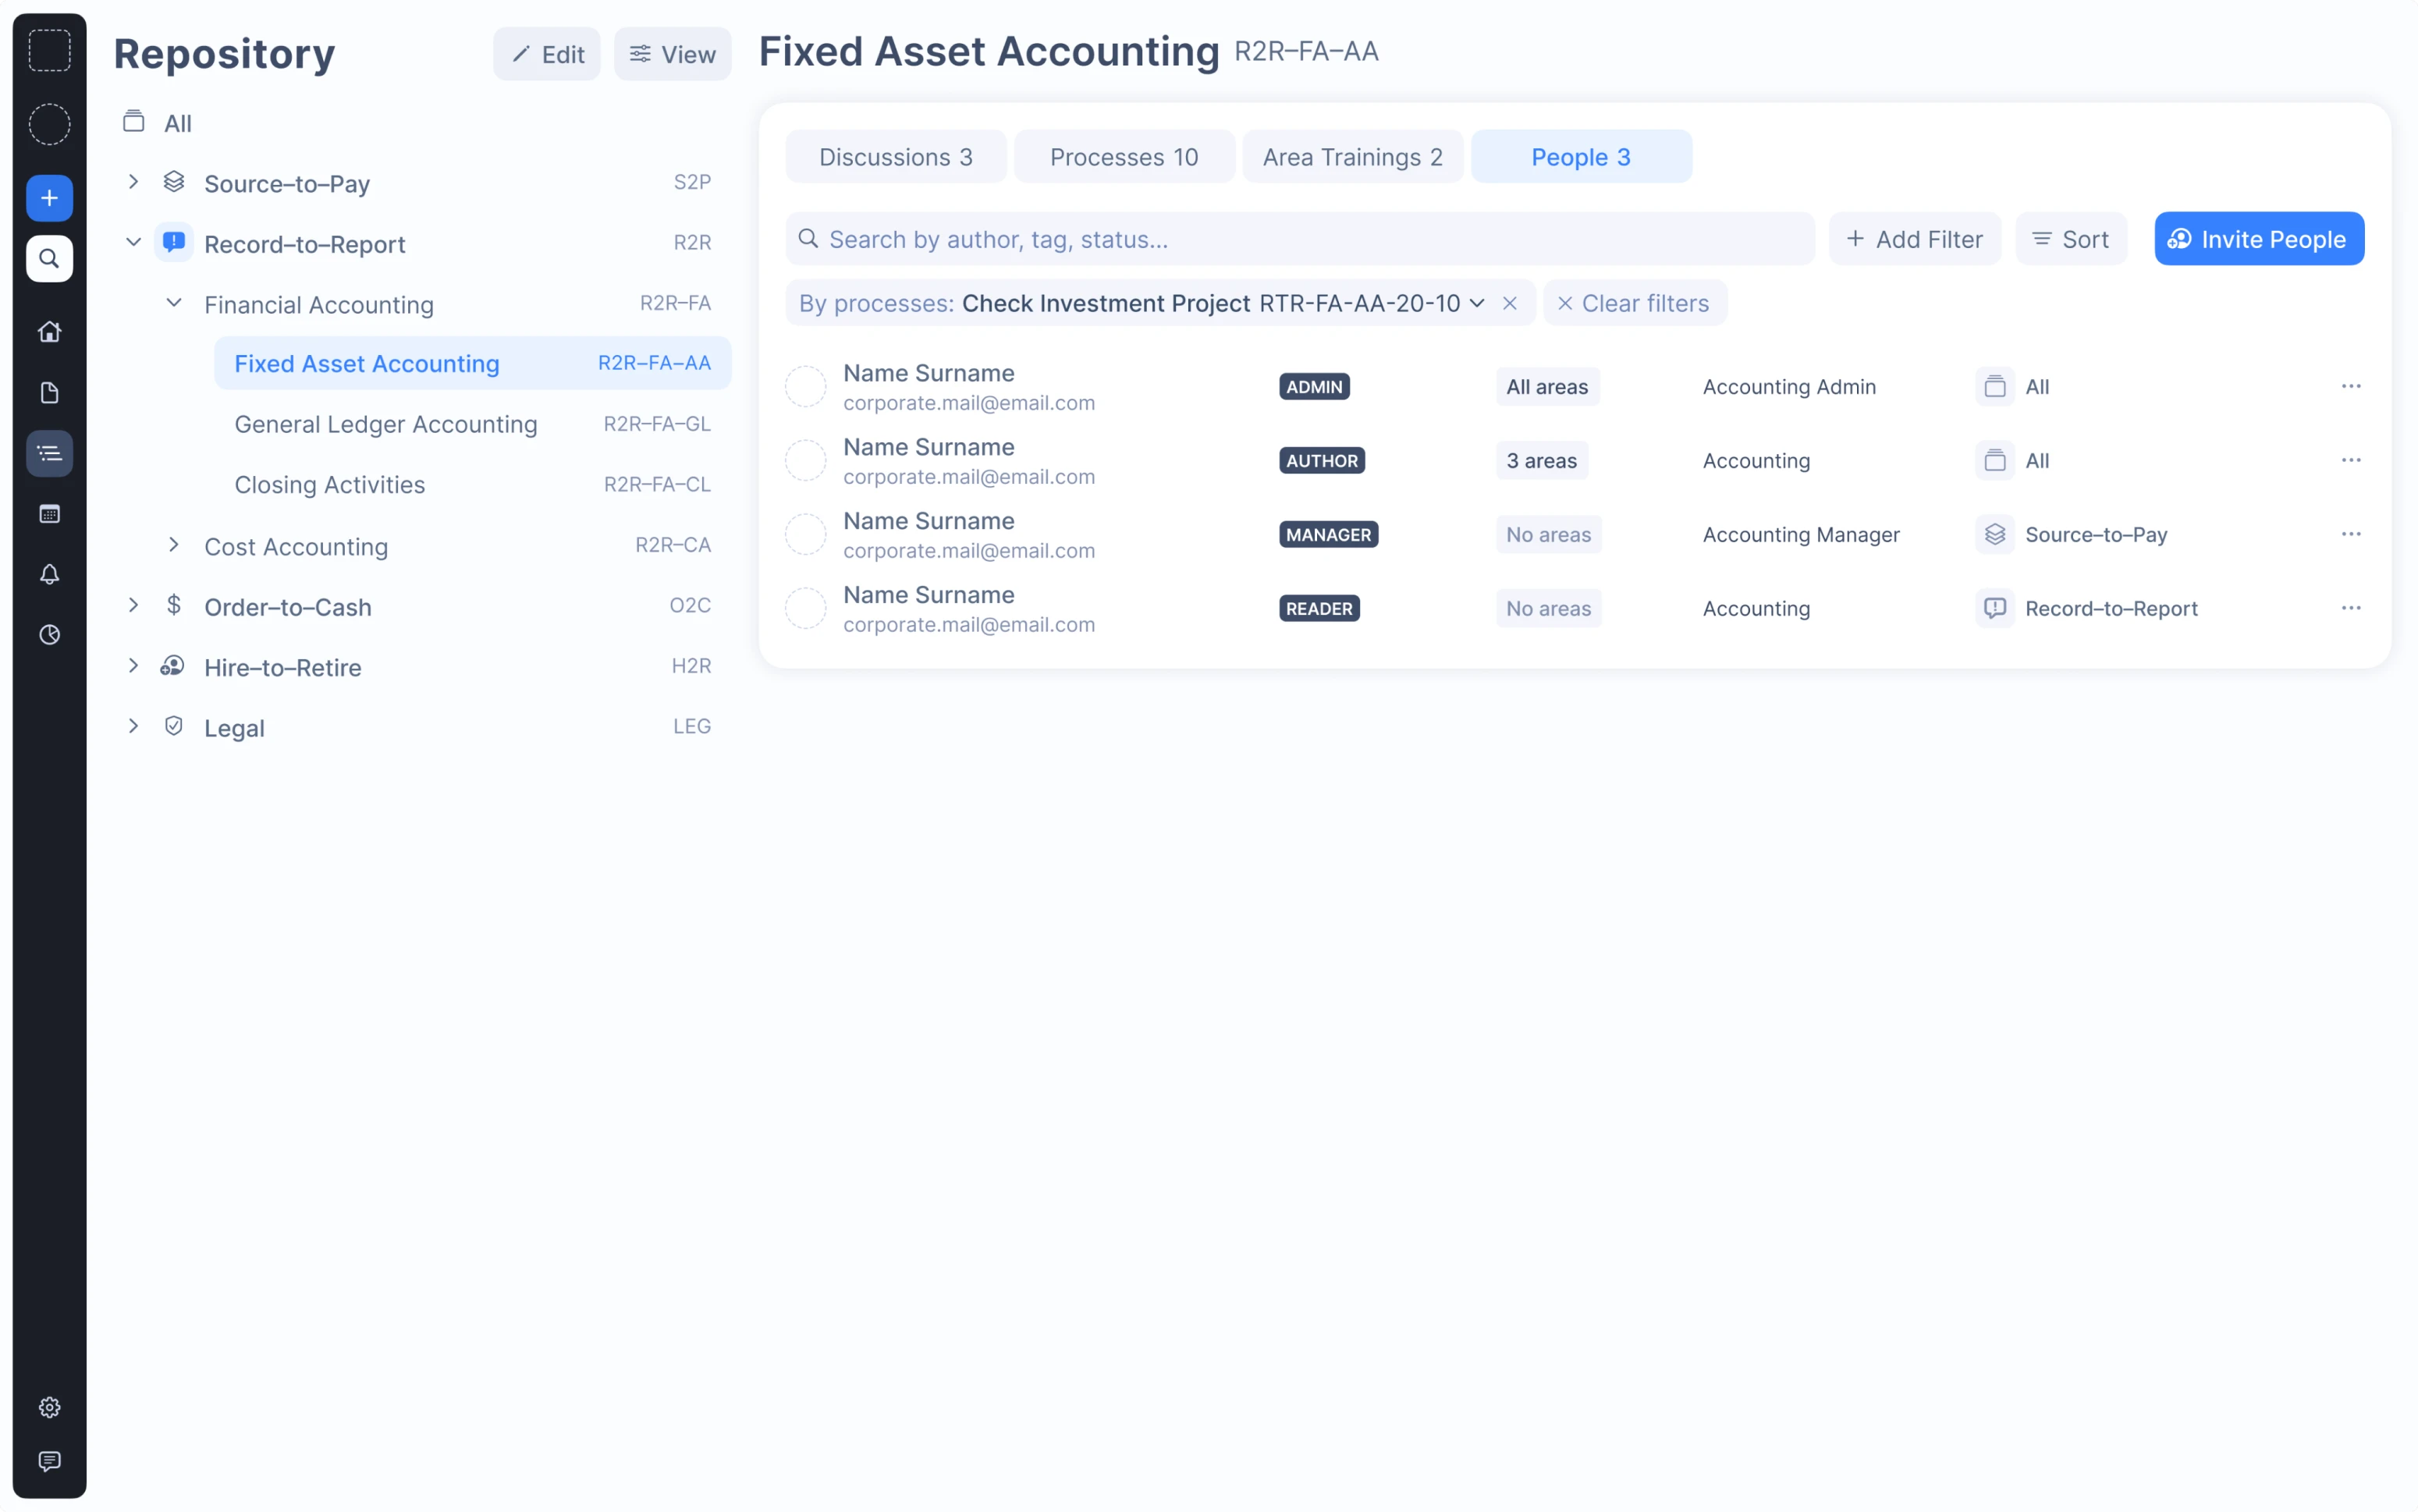
Step 2: Including the Discussion section to provide a collaborative space for all team members
Our designer placed the Discussion section on one line with the Processes, Area Trainings, and People sections to simplify navigation. Within this section, users can view discussions with additional information like payment details or responsible people. To simplify the search experience, our designer offered several filtering options: by process, author, tag, or status.
To streamline communication, our designer created a workspace where users can ask questions about work instructions and leave feedback. Users can also highlight text pieces, raise questions, and tag them, as well as reply to comments, add reactions, and report a problem. Every comment or reply is visible to everyone.
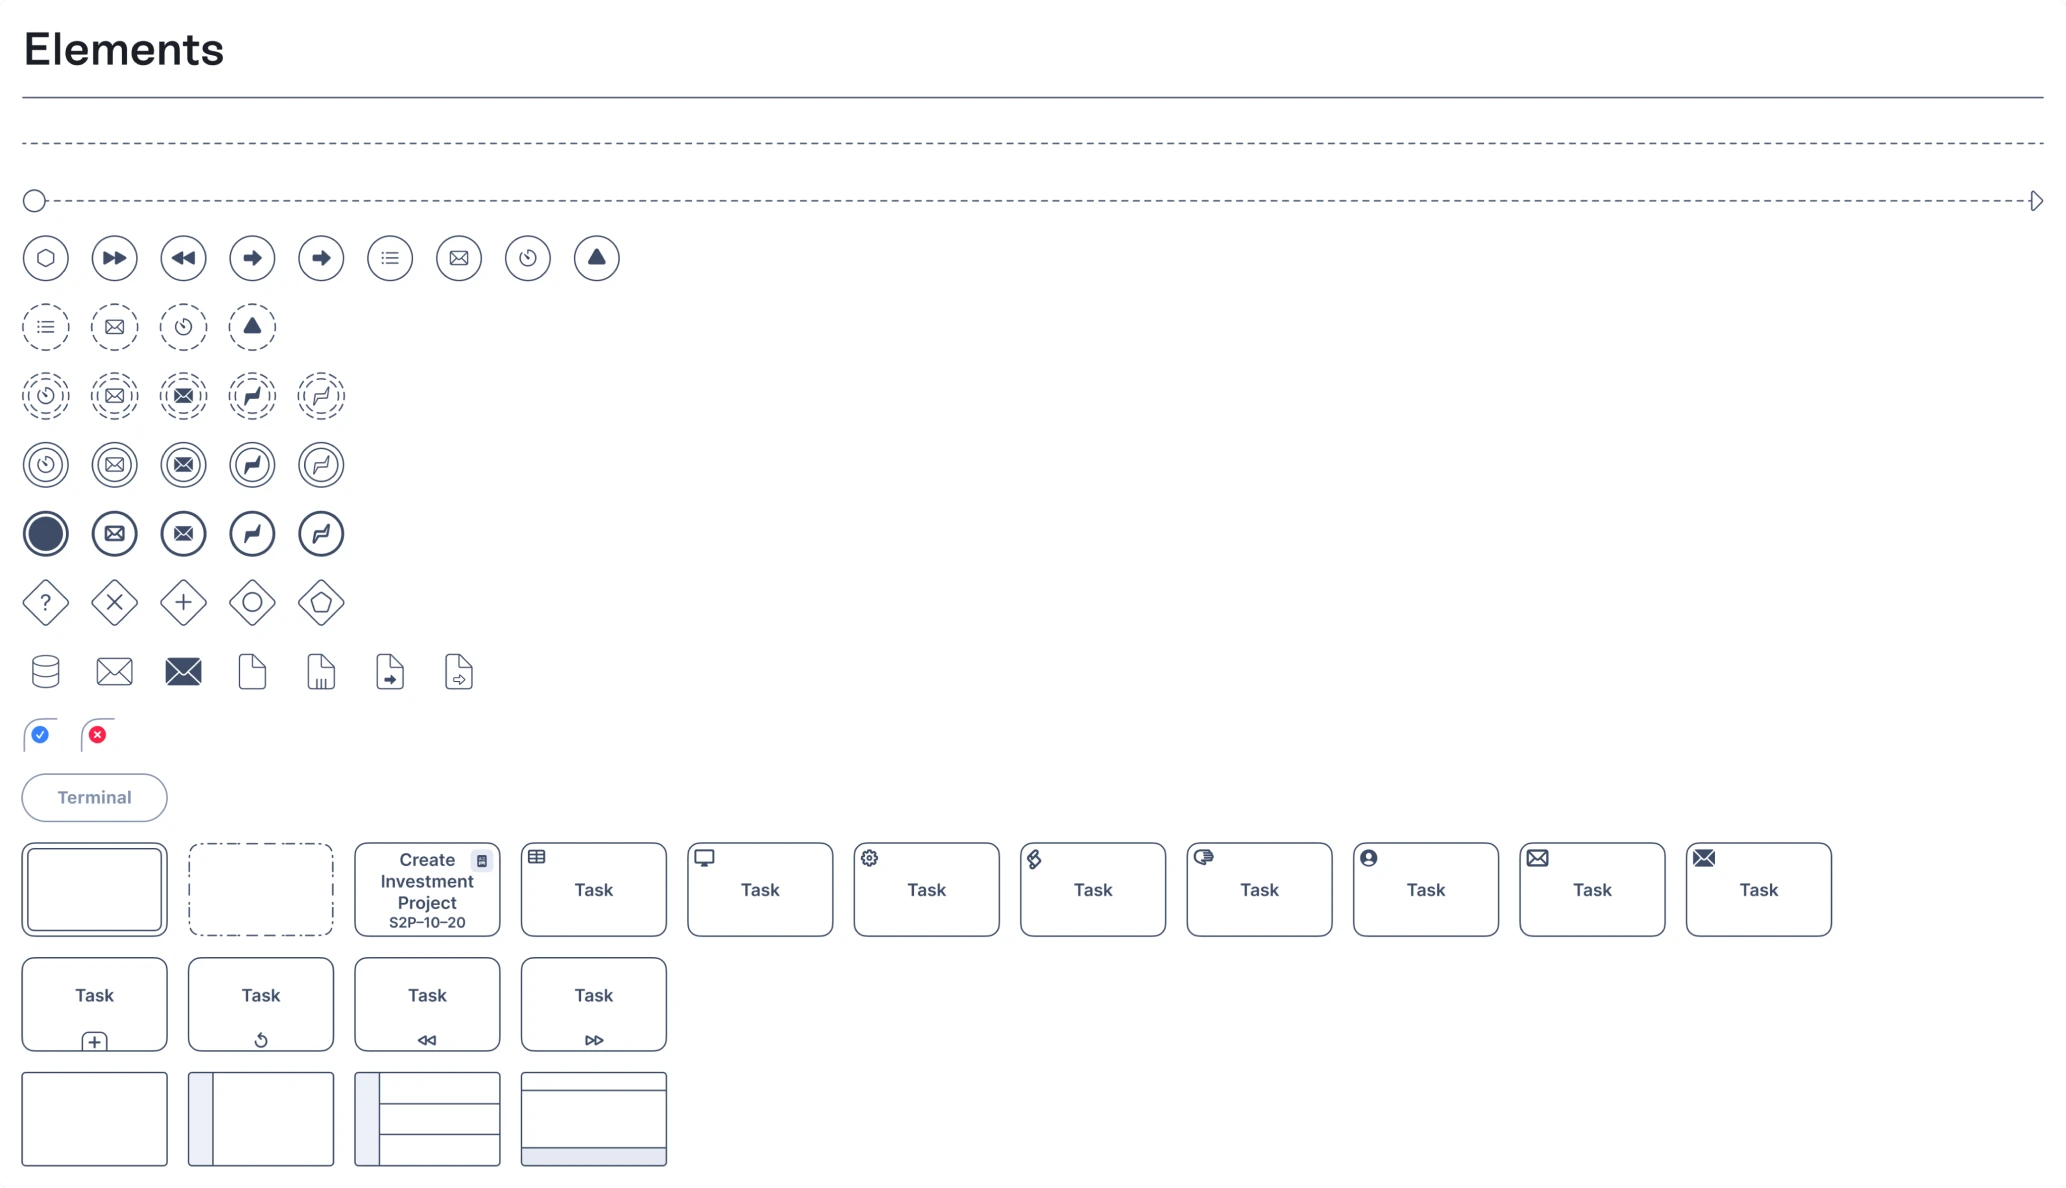
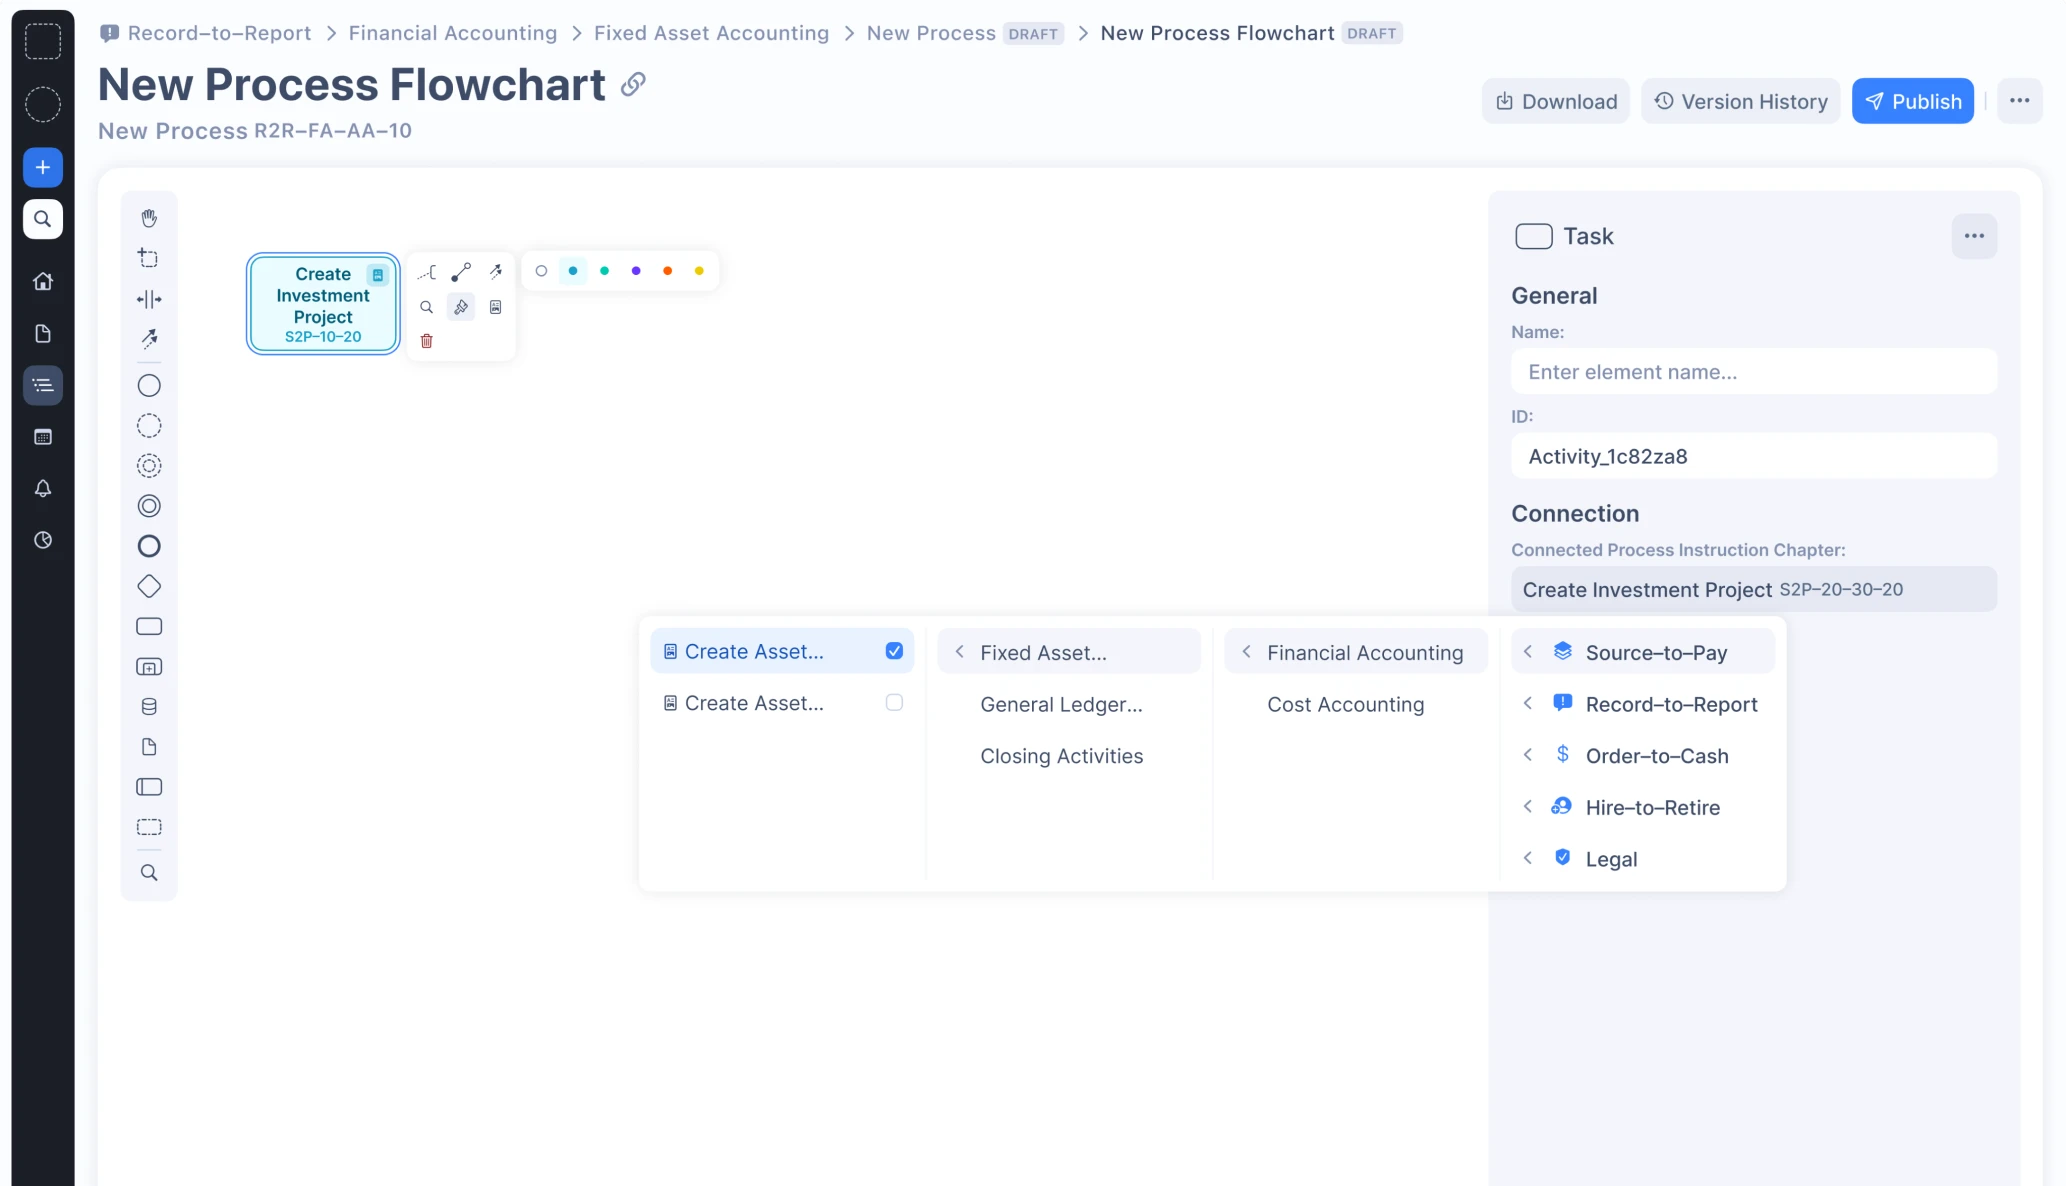
Step 3: Adding the Flowchart Maker to simplify workflows and daily routines
Following the goals of designing a solution where users have all critical tools under one roof, we included the Flowchart Maker. This workspace has many built-in symbols and elements for creating flowcharts and BPMN diagrams.
As everything is stored in one place, users can insert the necessary data from other processes, as well as draft, store, and share process instructions matching these flowcharts.
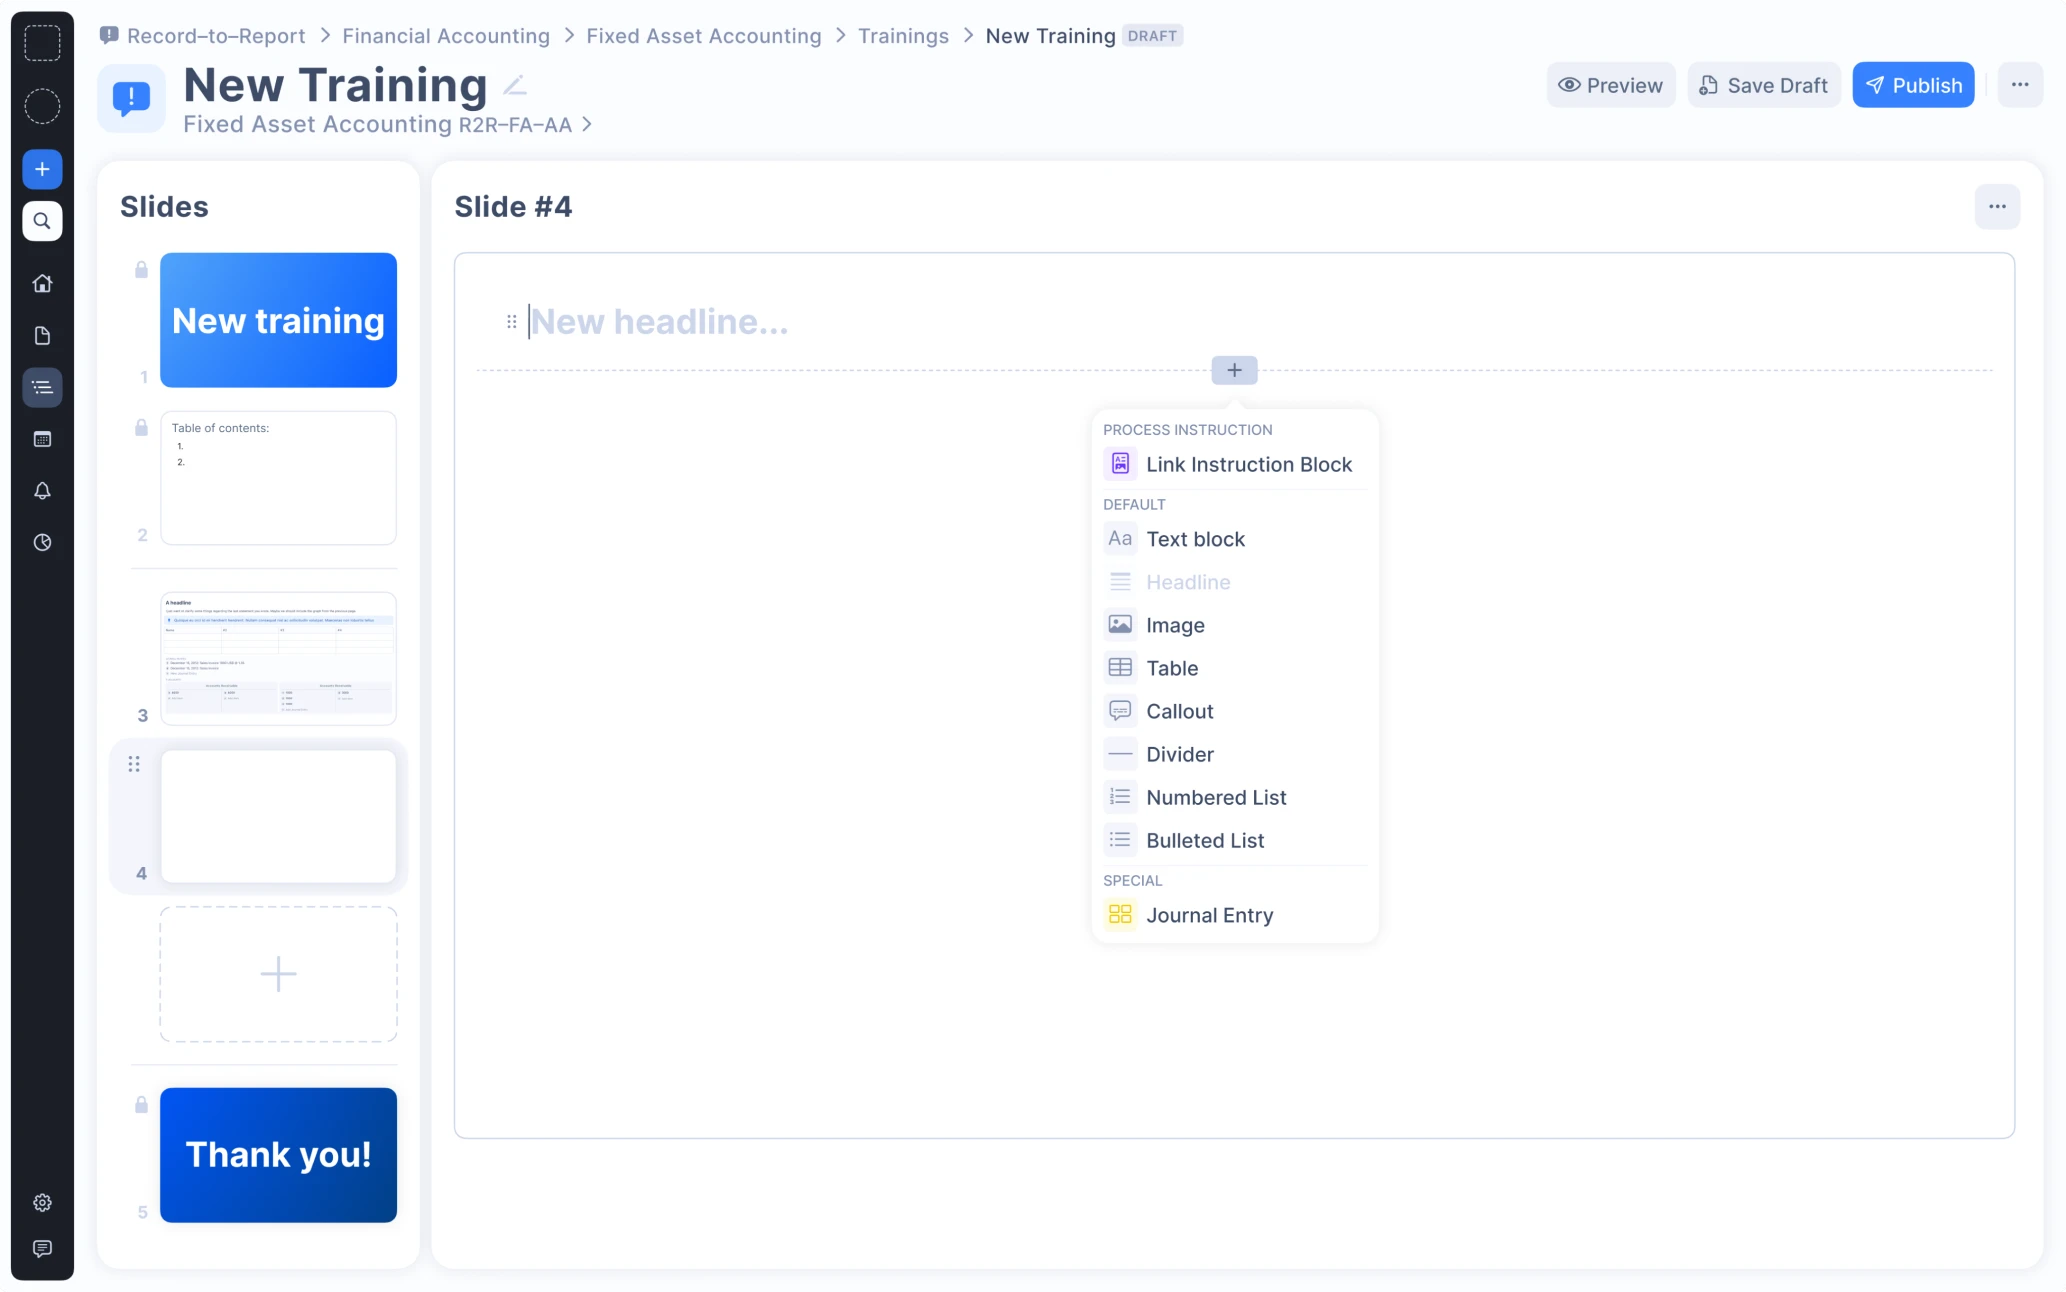
Step 4: Making the Training Creator to generate training materials and presentations
Next, we had to make the training creation process customizable, letting users draft, store, and generate training materials from all processes.
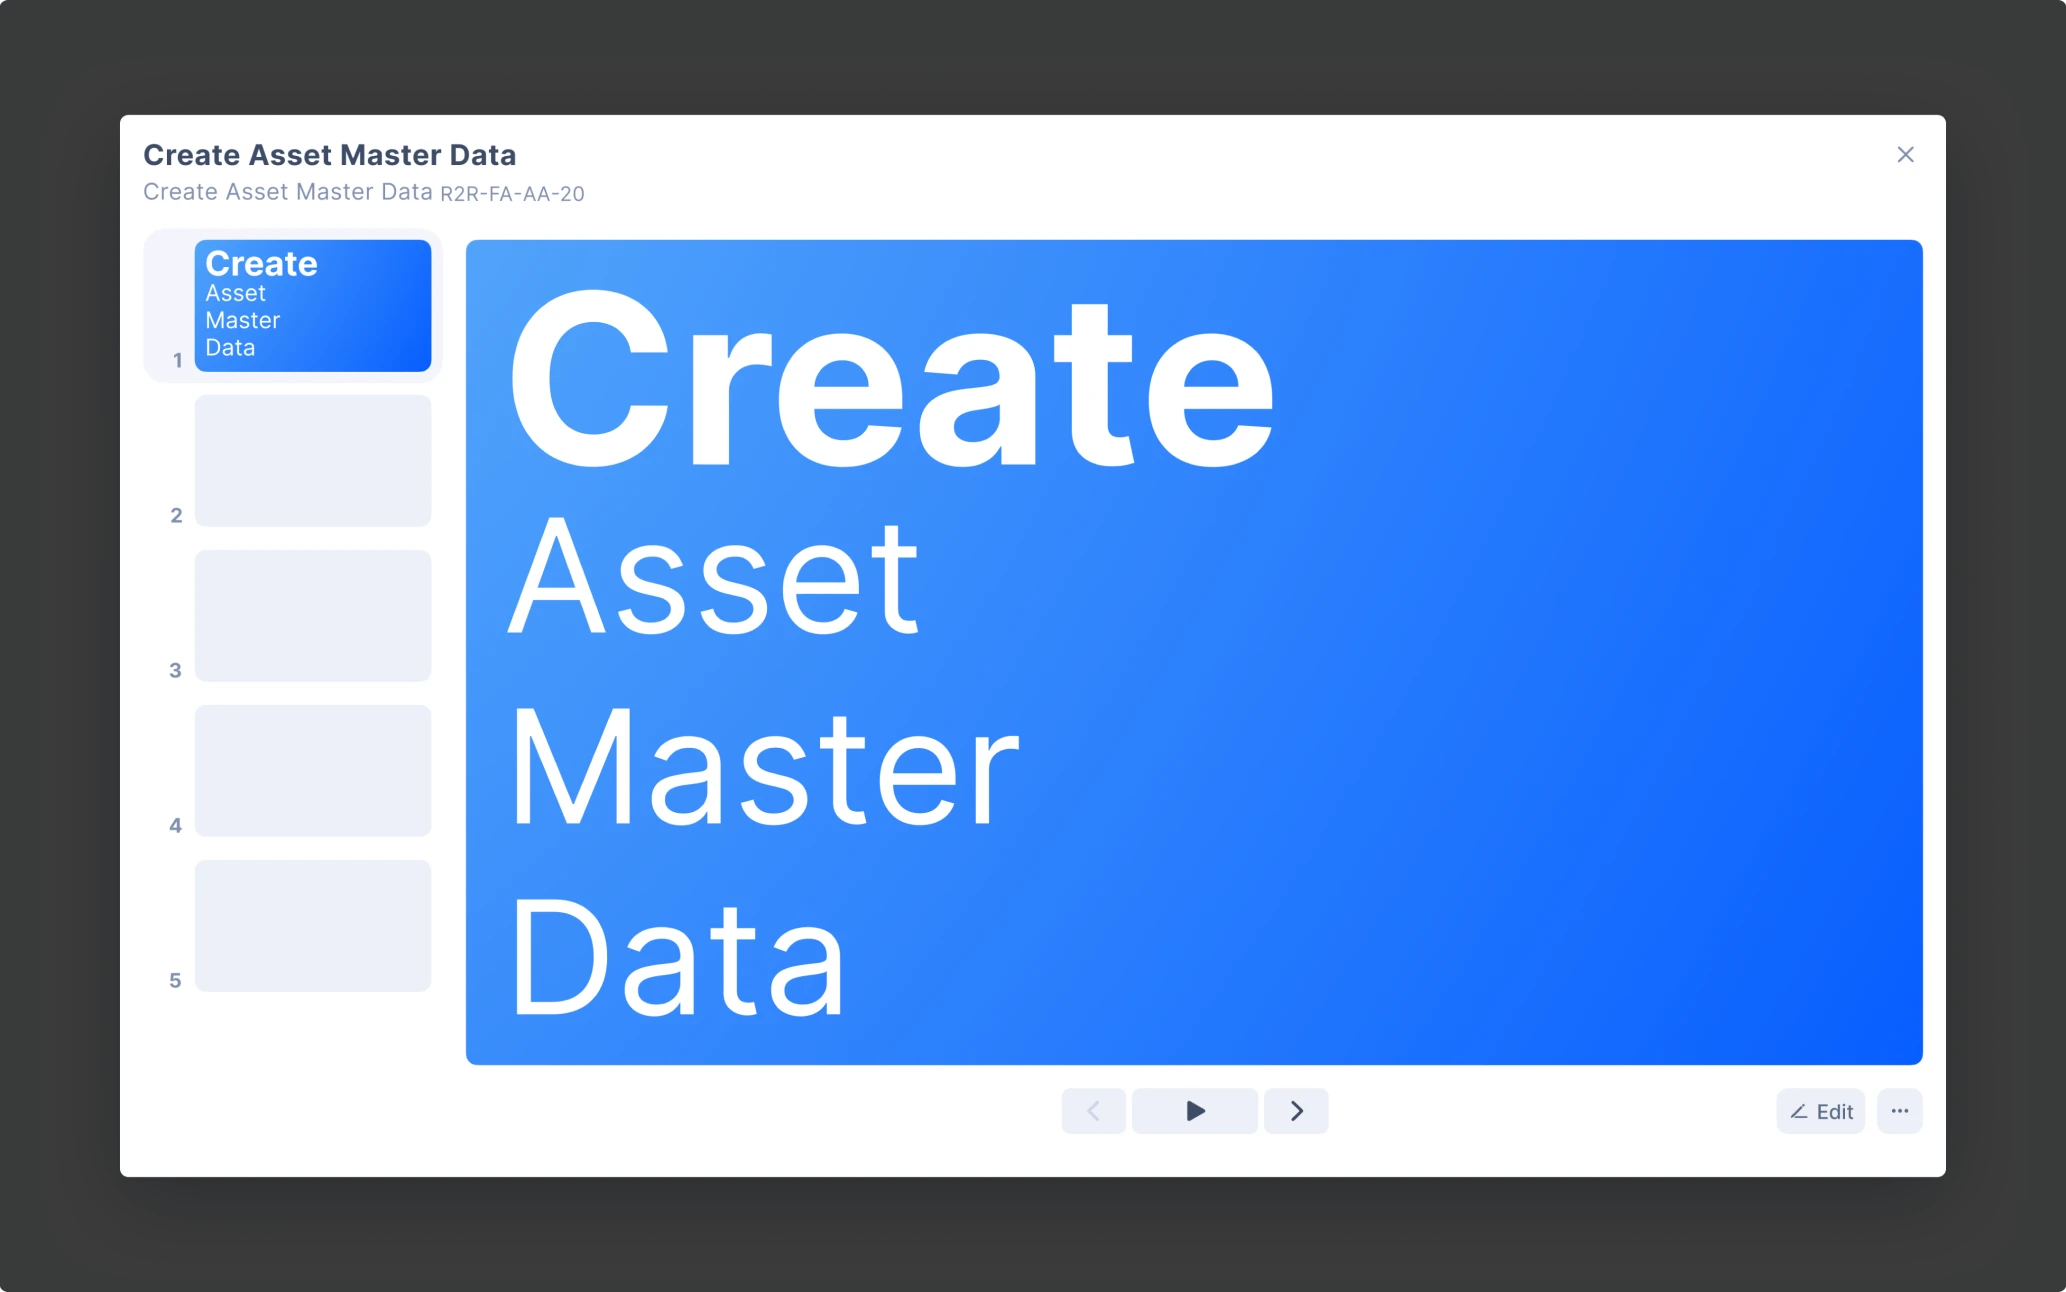
We divided the training page into two parts:
- On the left side, there are slides for all teams. Users cannot change this part.
- On the right side, there are customizable blocks that users can move. These blocks are connected, so it is easy to proceed from one block to another or other processes. Users can add links to other blocks with presentations from the platform database or processes.
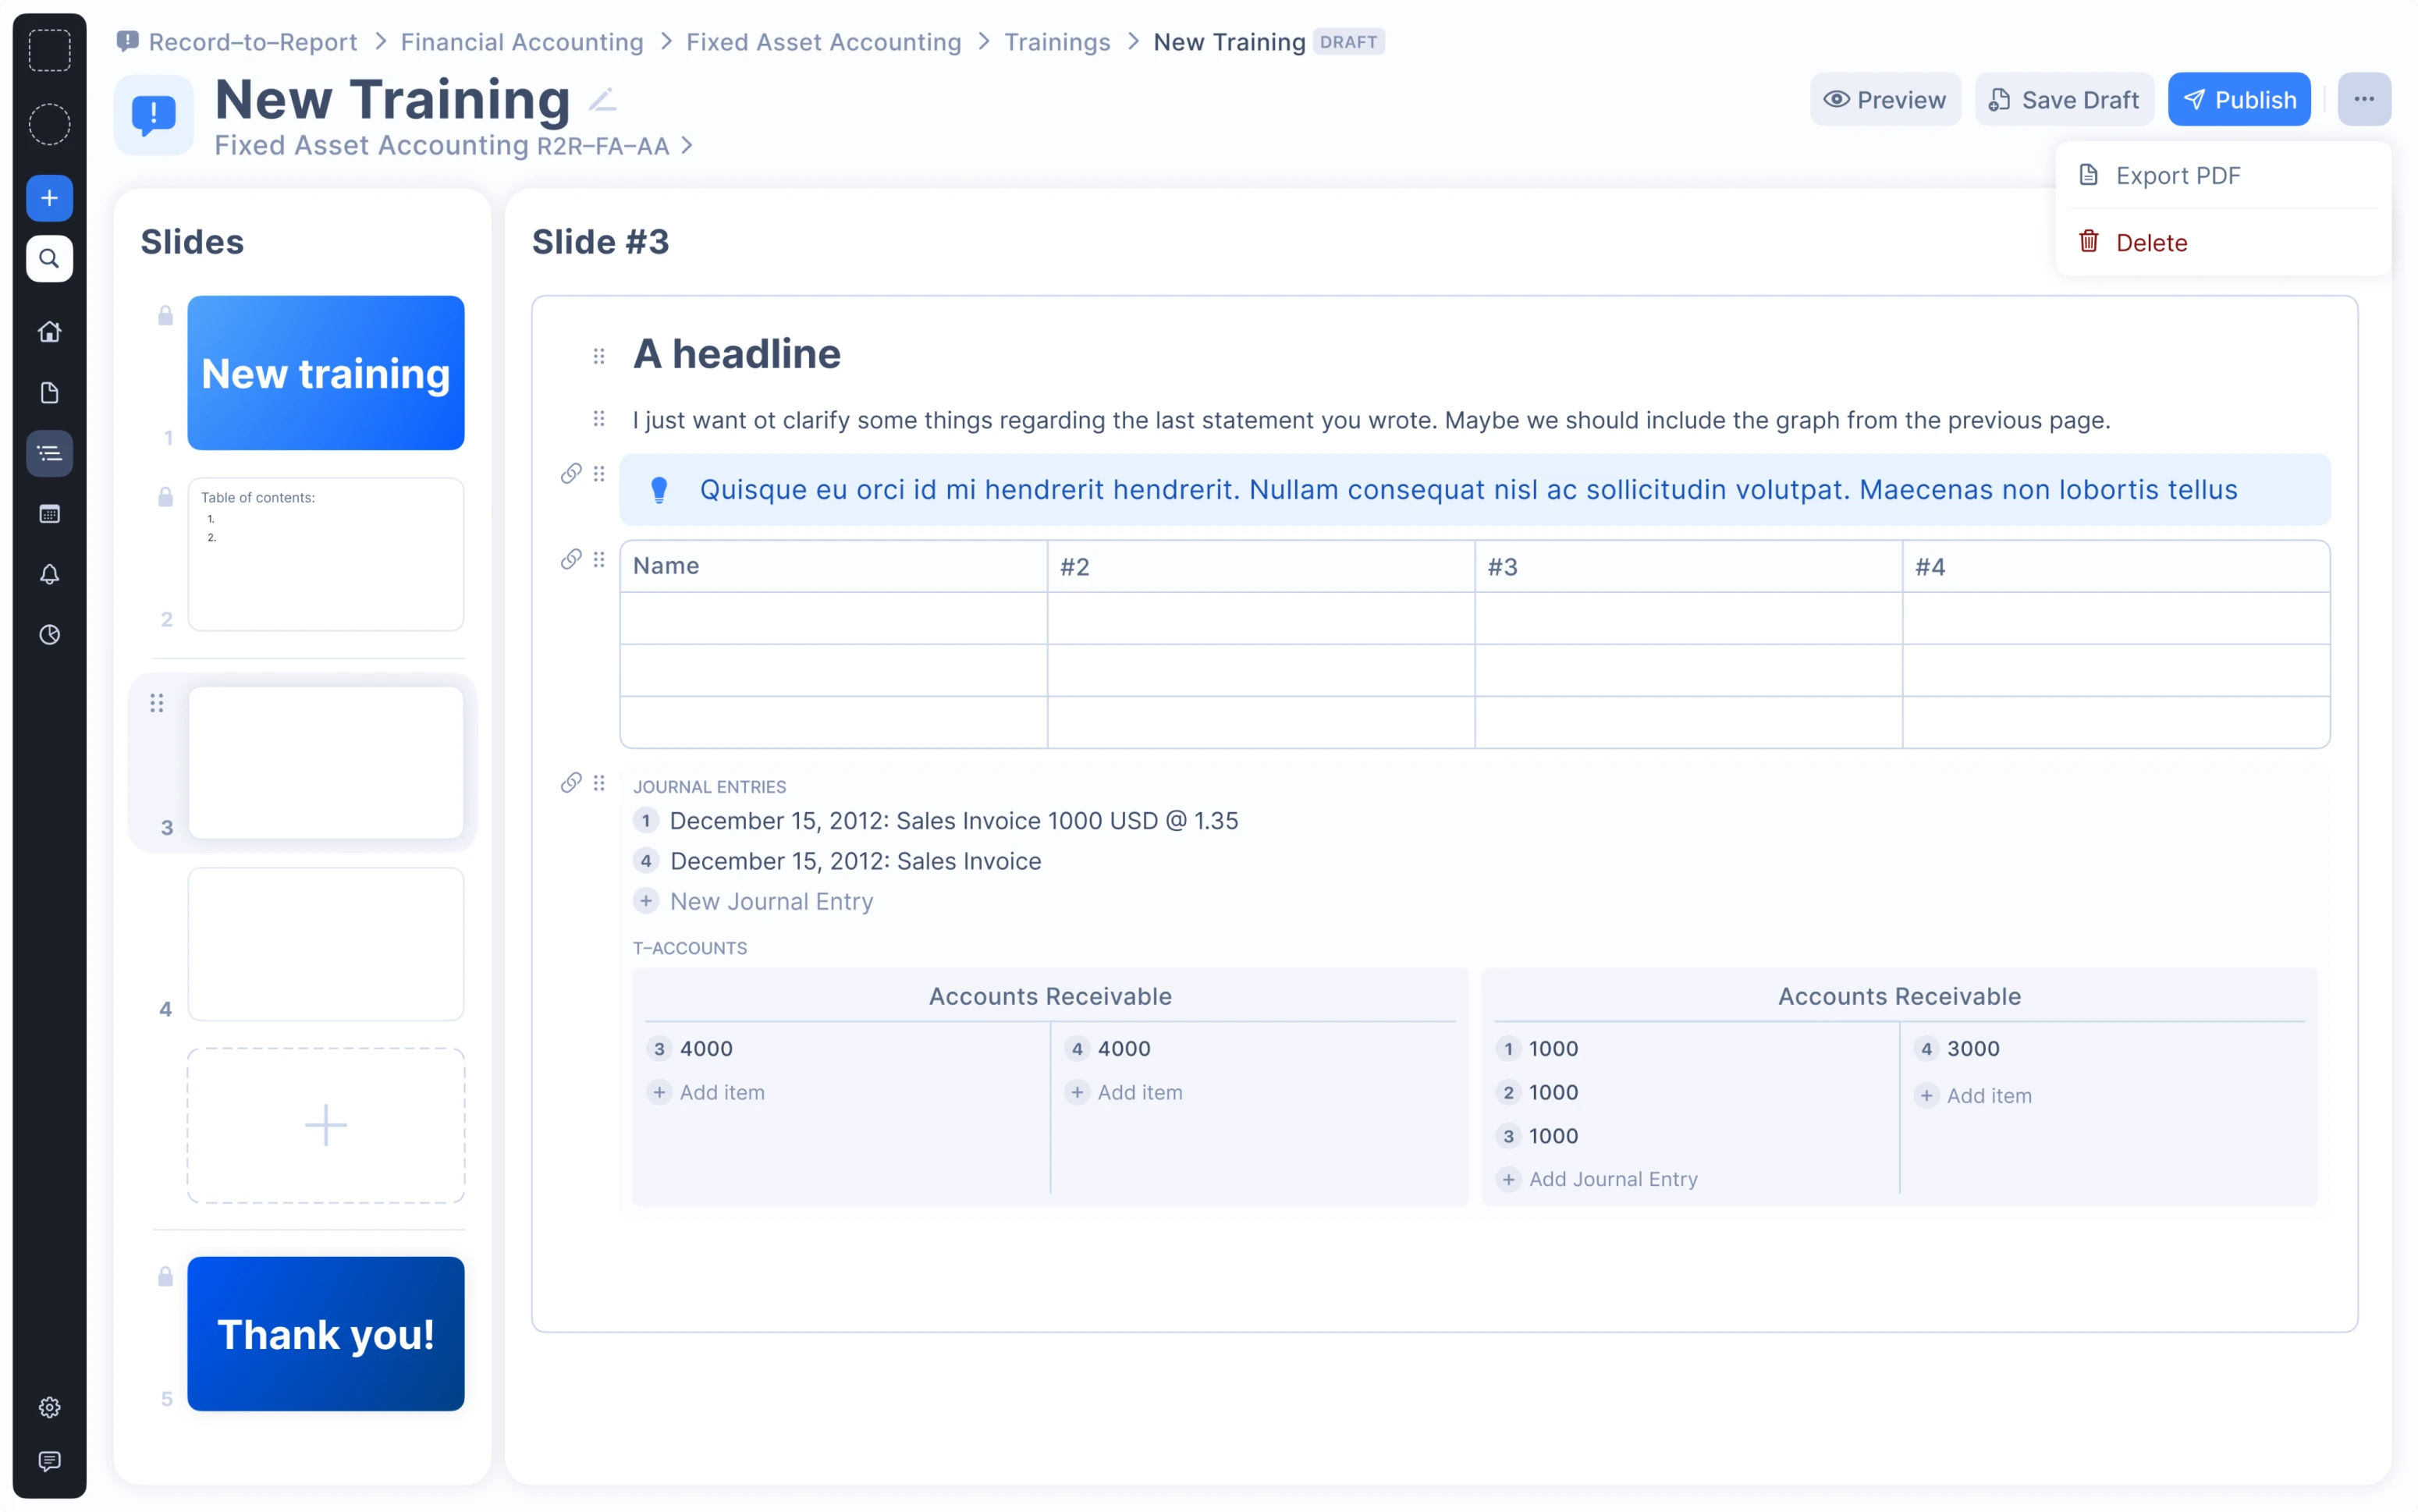
To maintain consistent knowledge levels within all teams, we added the shared space where decentralized teams could create training materials or presentations and share them across their organization. The teams can also track the process changes in the training materials.
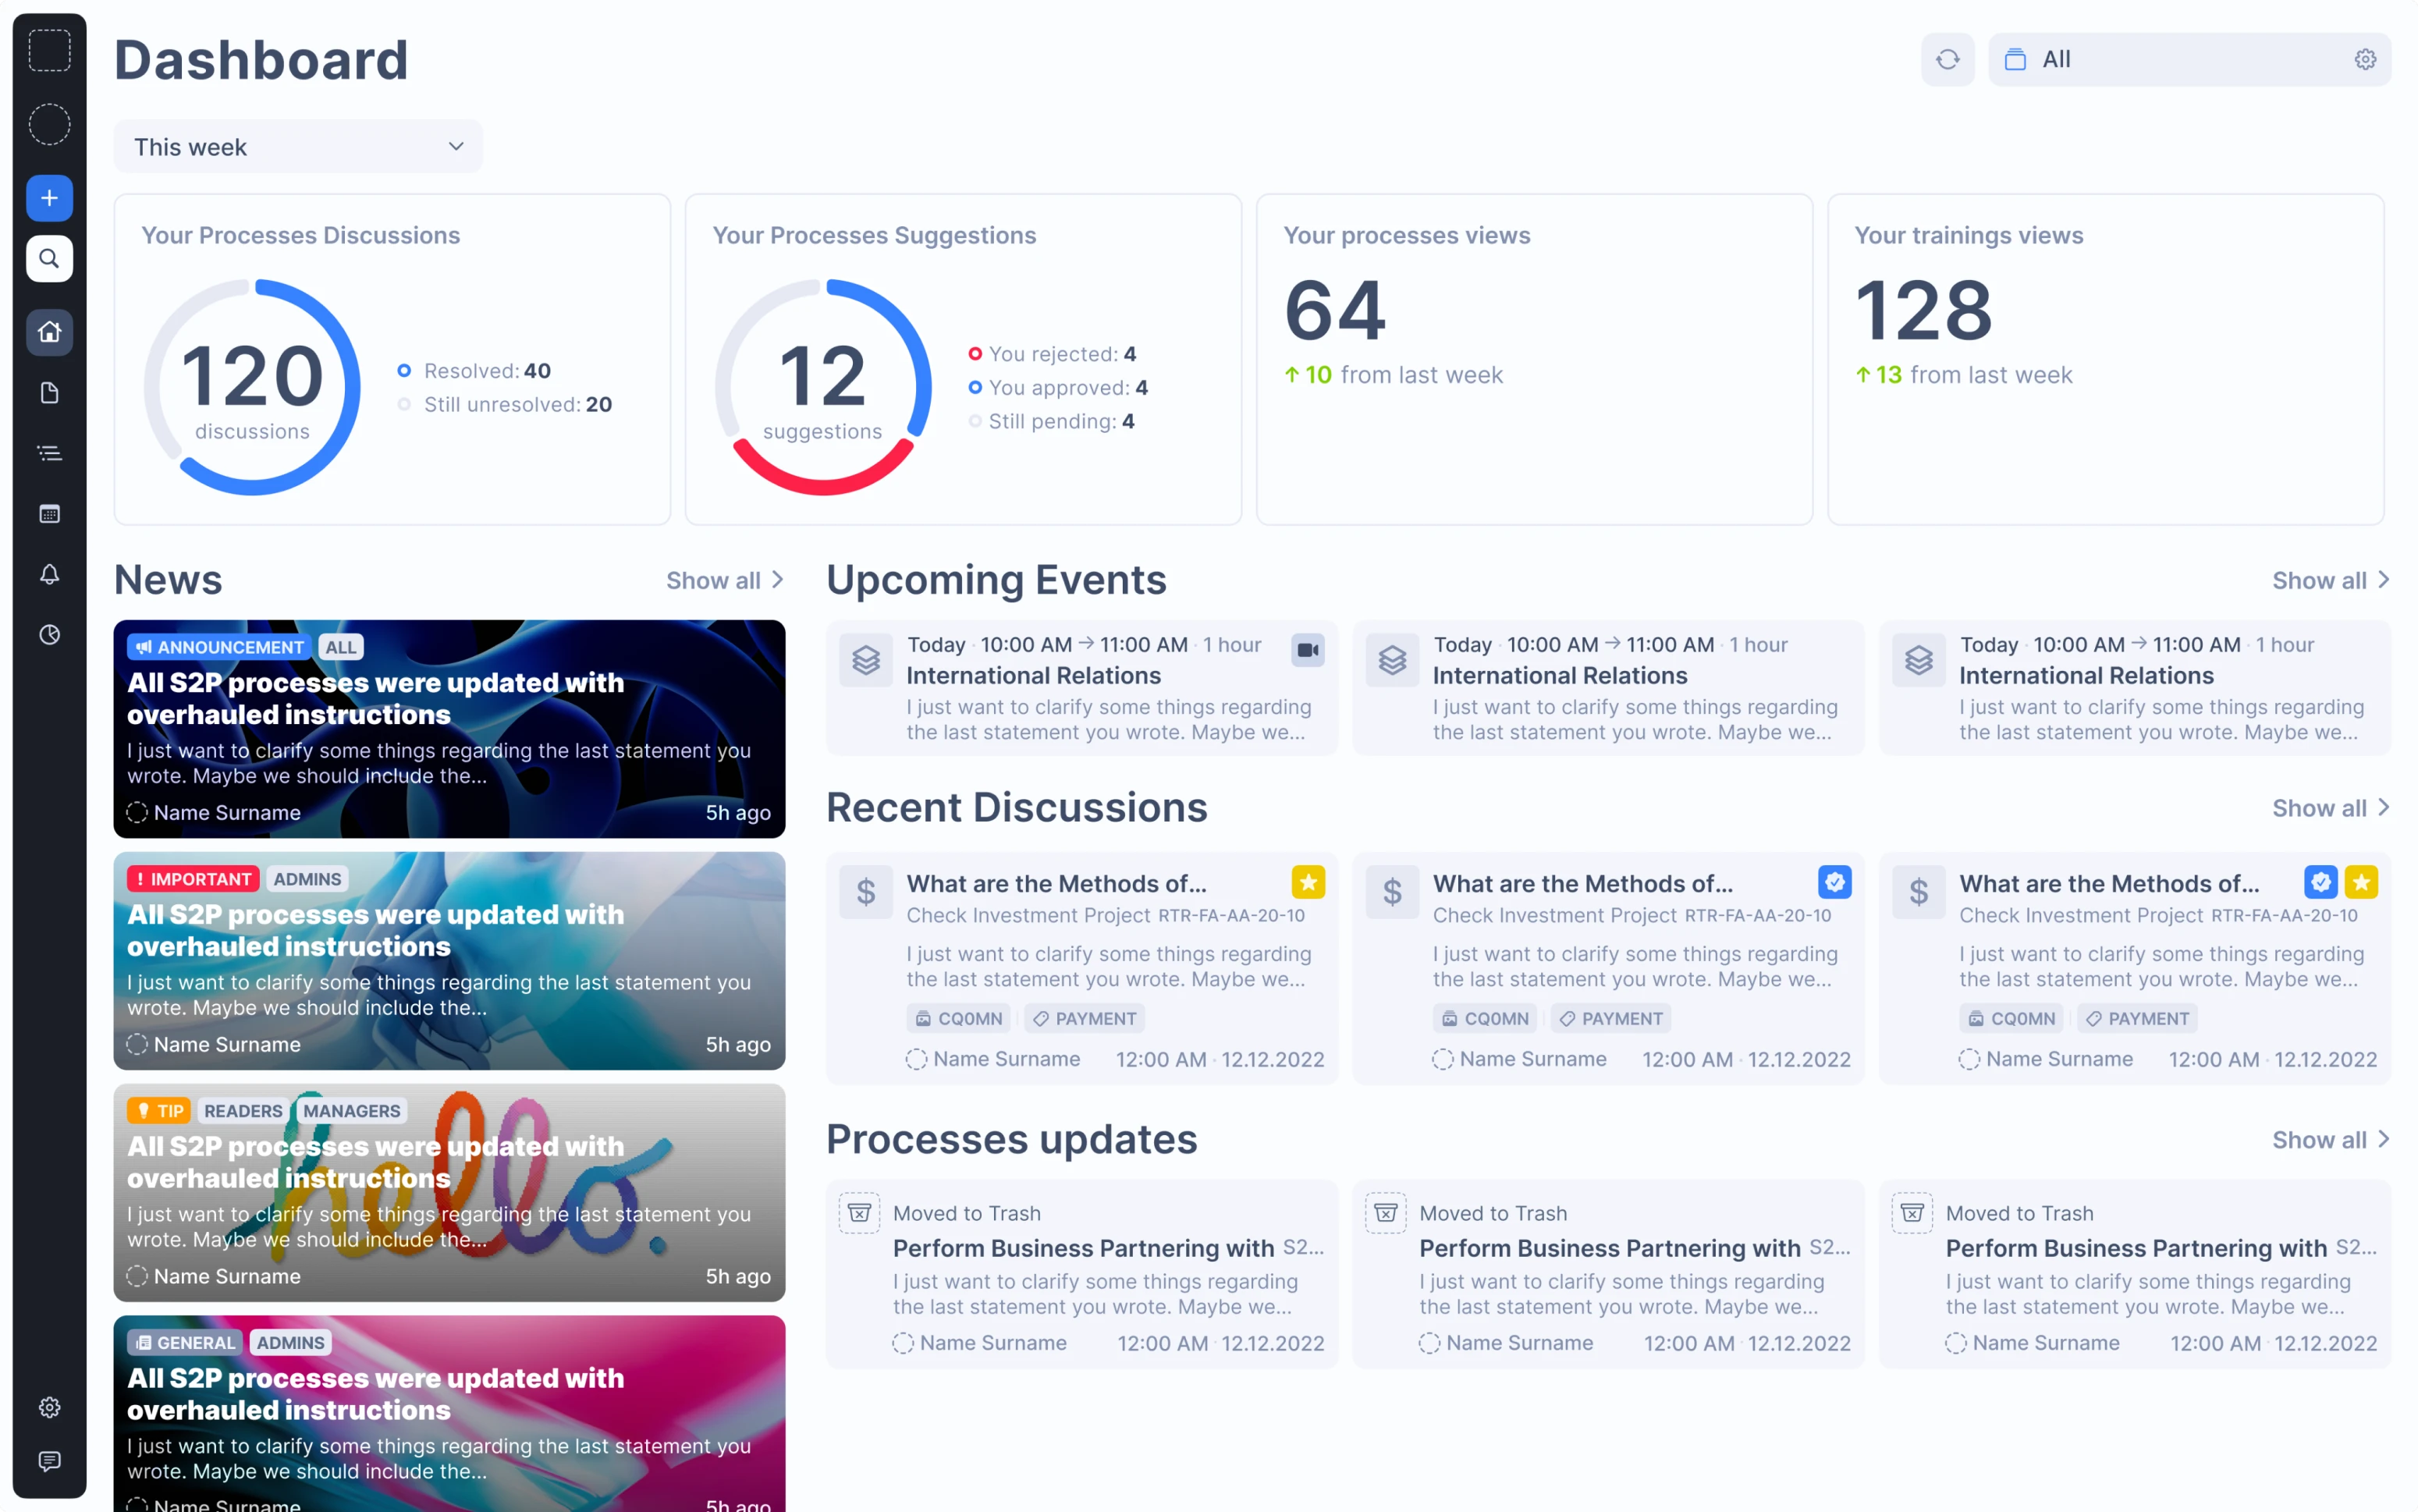
Step 5: Creating an end-user dashboard to execute the processes and get access to information
Our client wanted to create a separate end-user dashboard for the People section with a search bar. And we did it.
The People section has a table with employee names and roles. Users can invite people, create, and edit profiles.
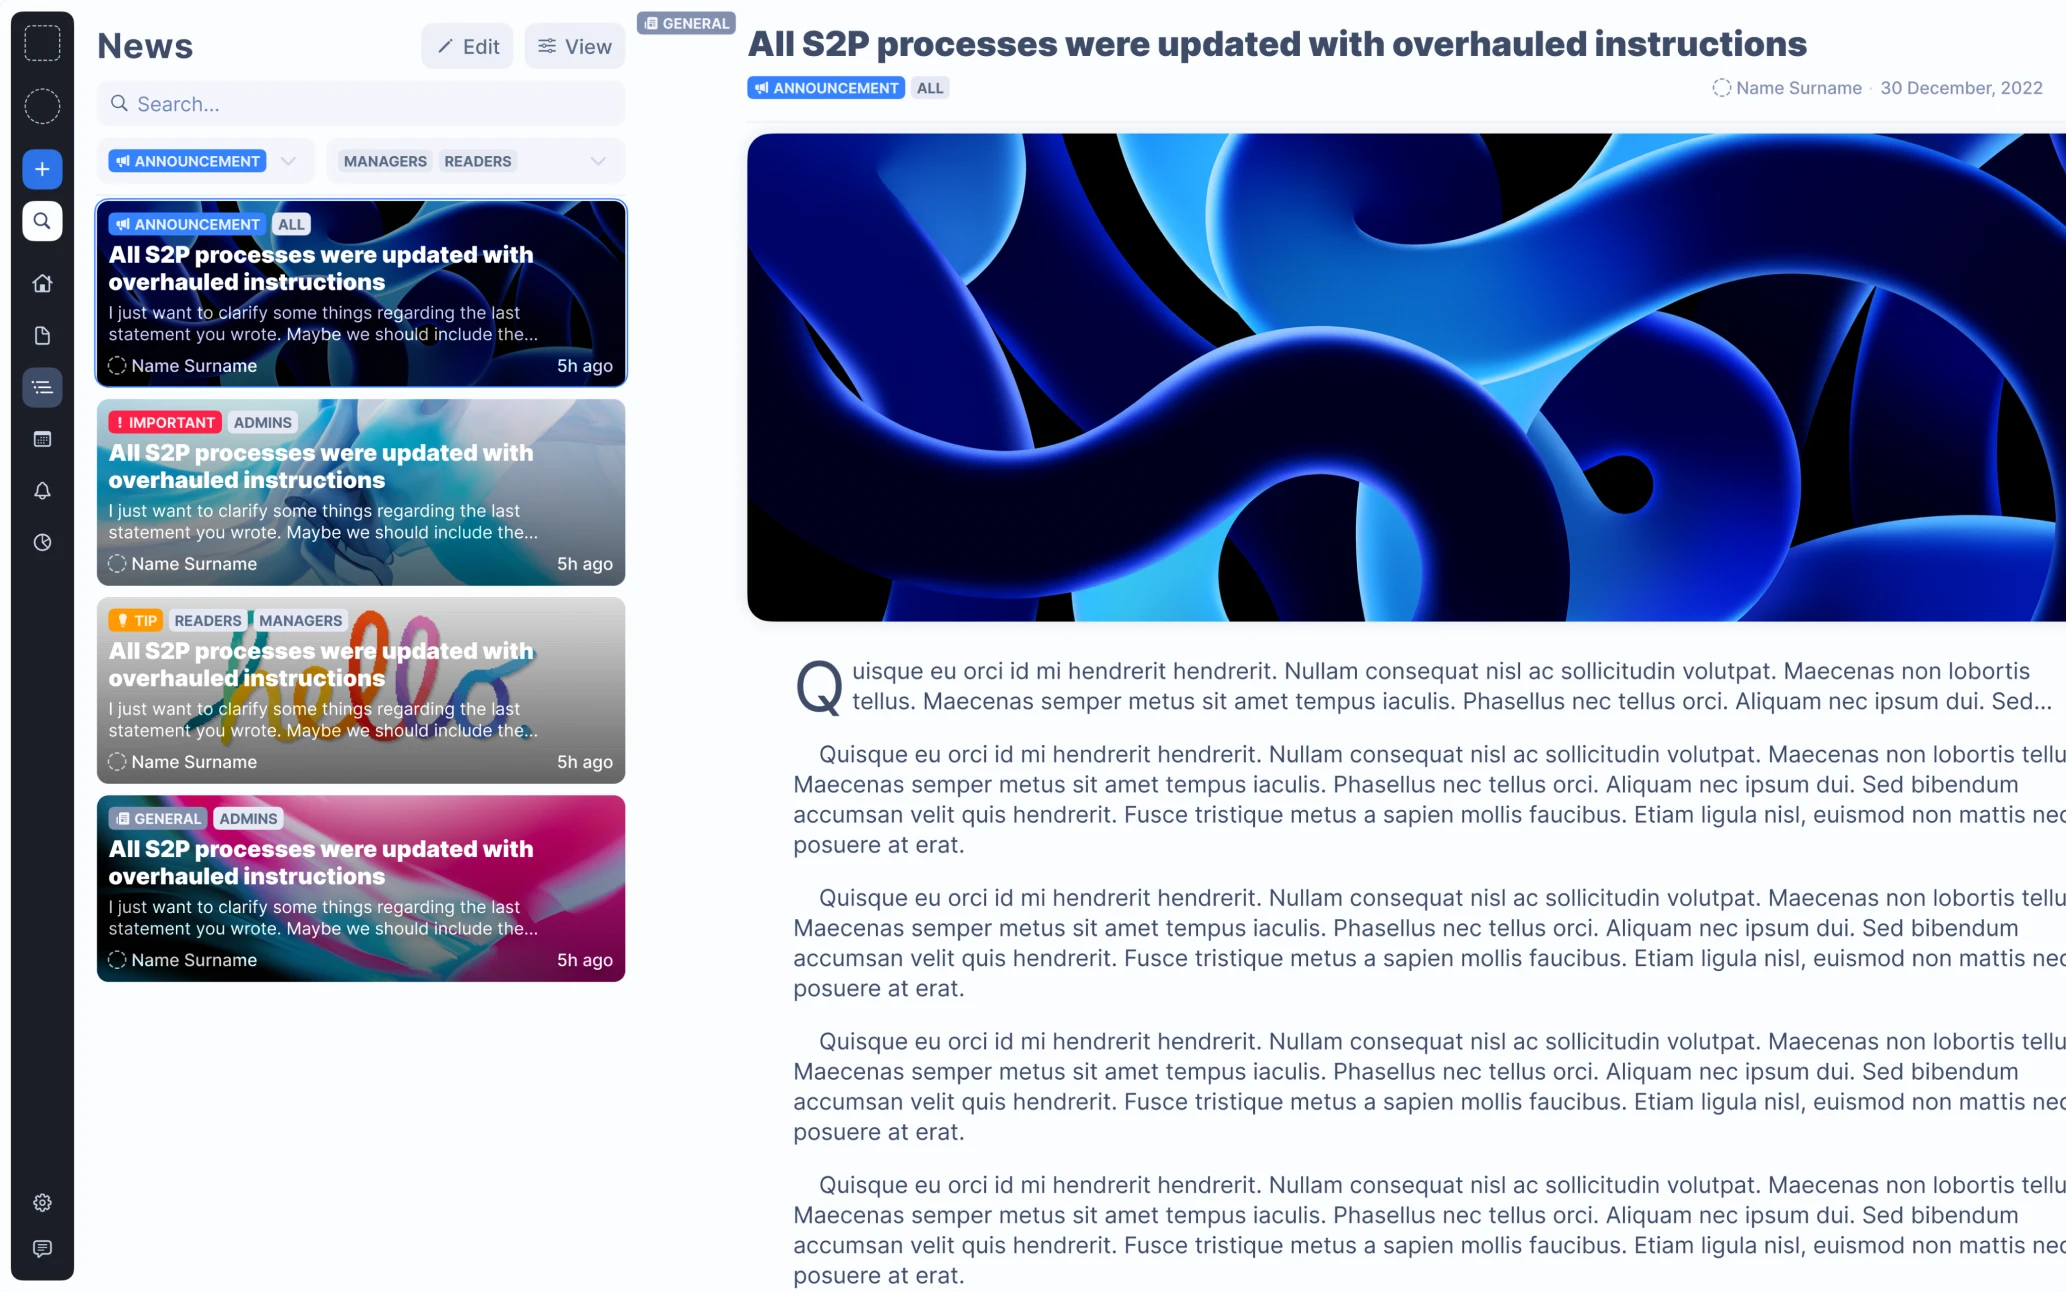
According to the client’s request, we also added sections for upcoming events, company news, and process updates.
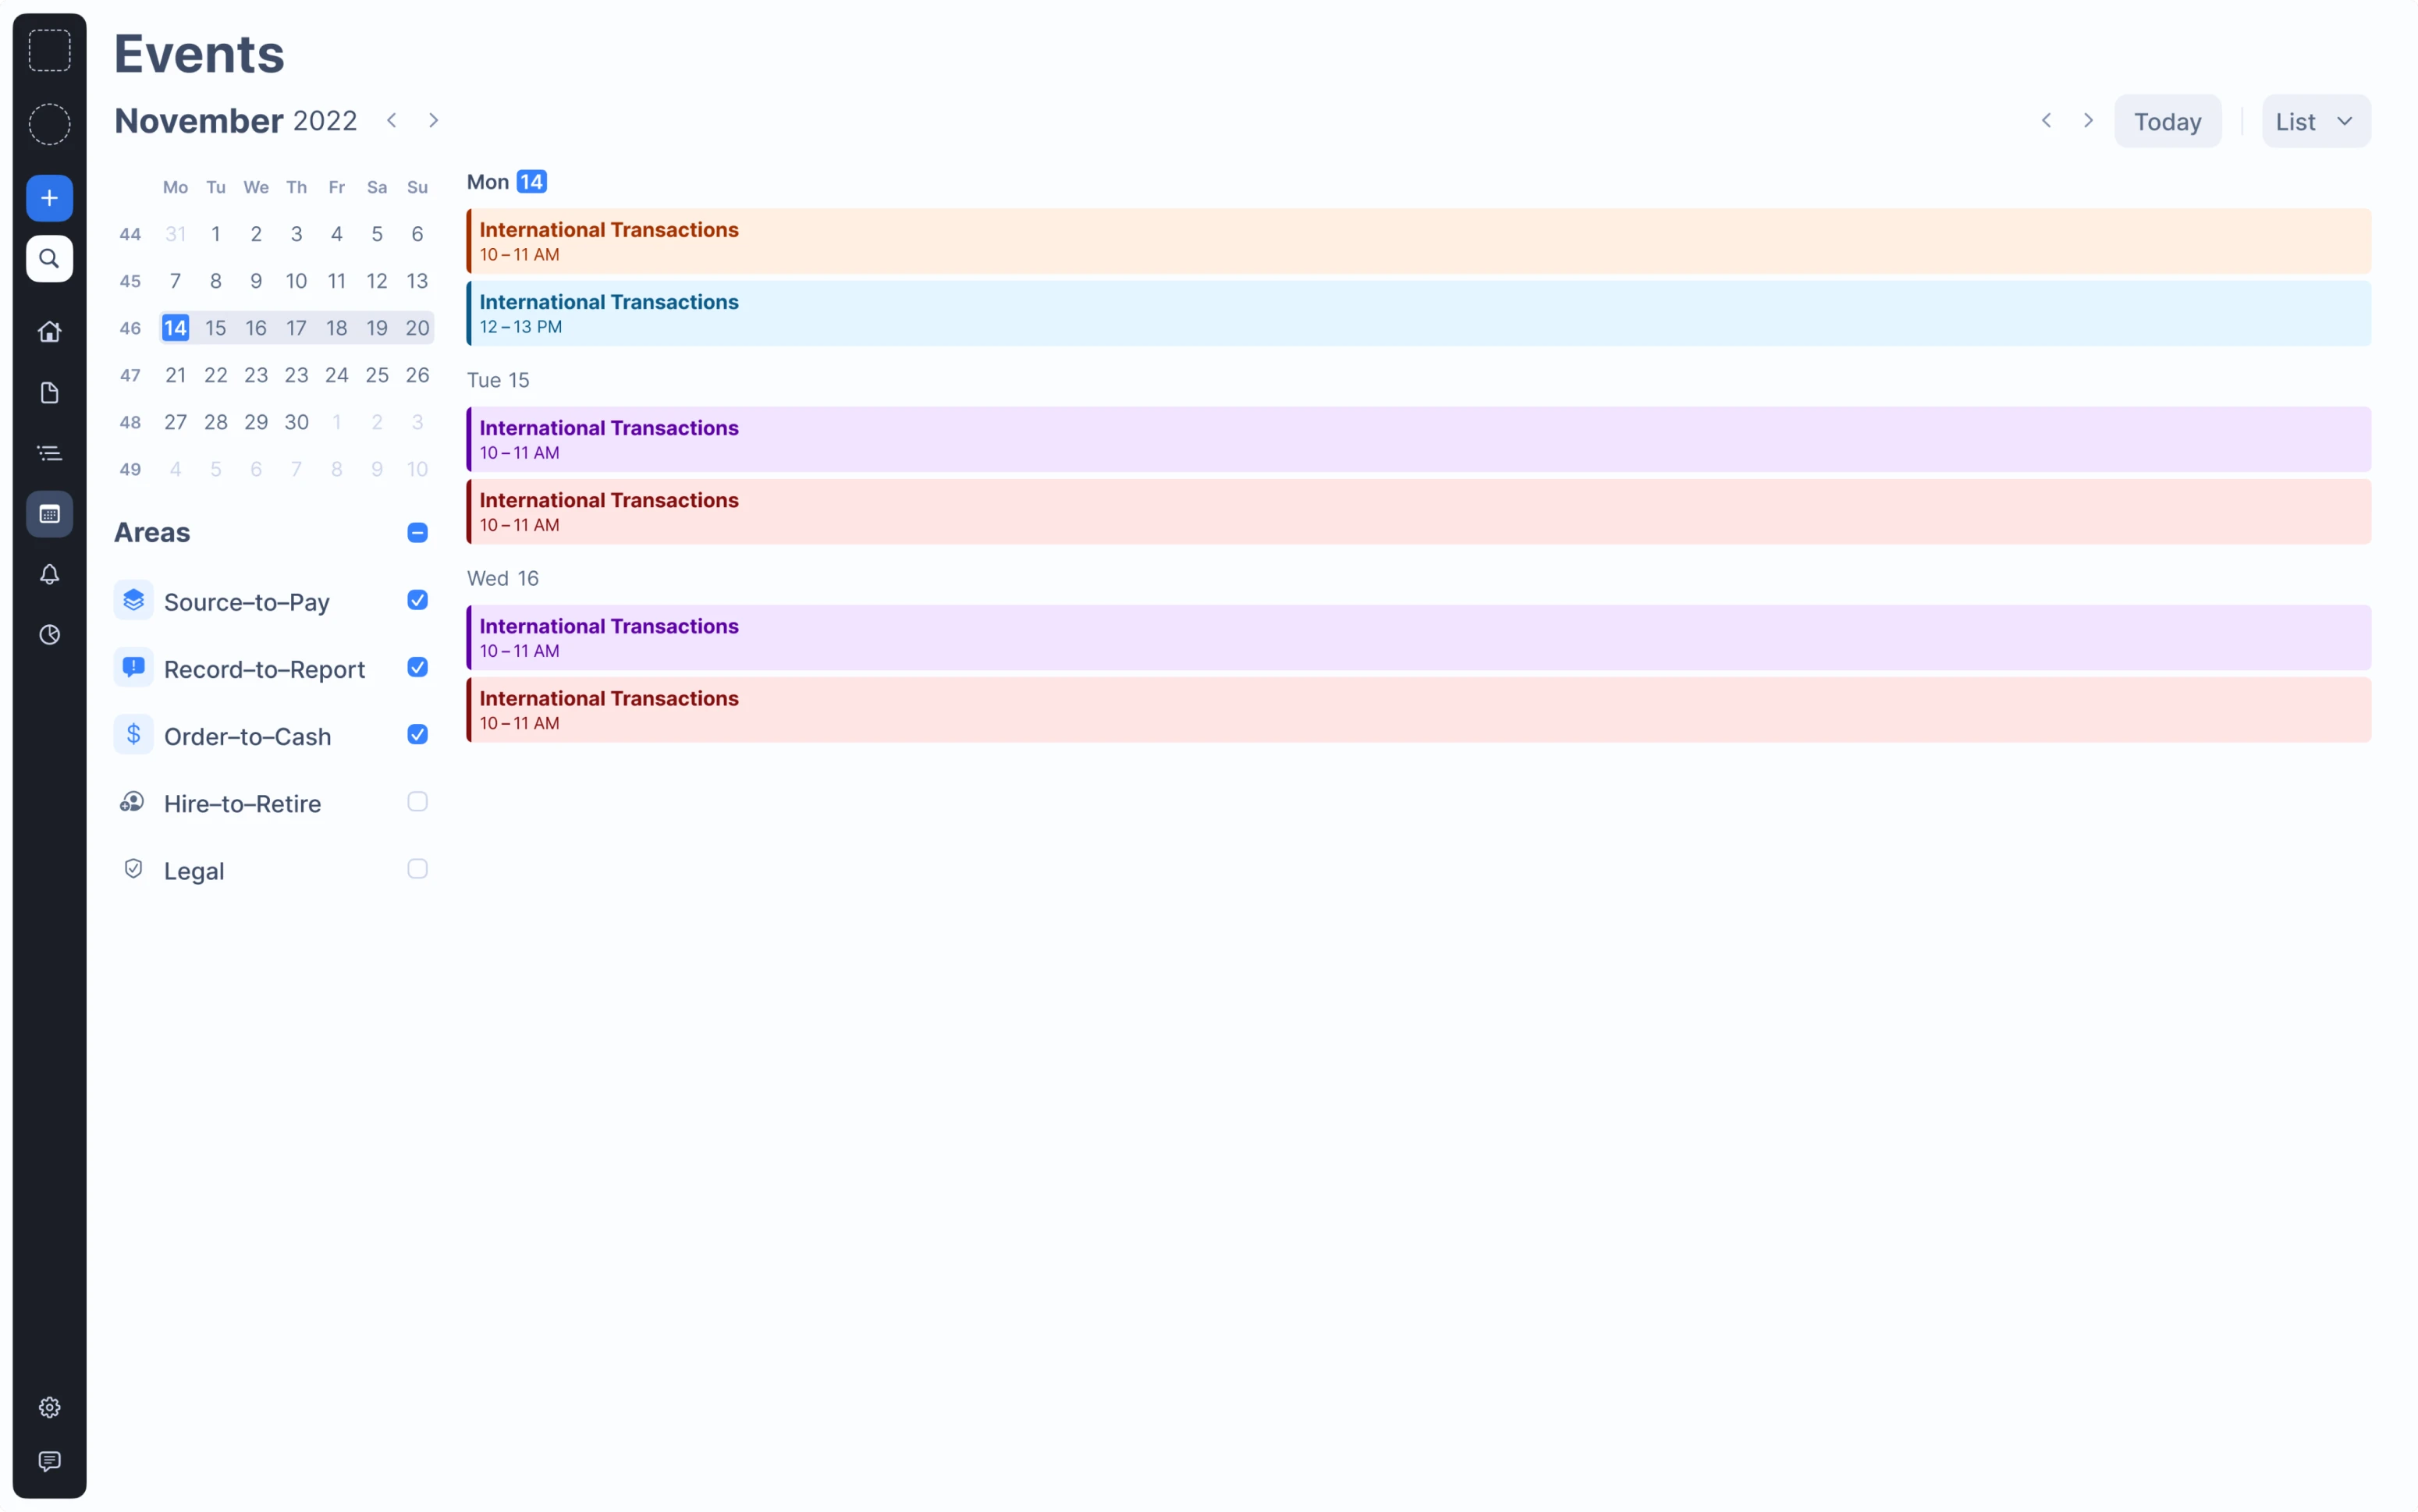
As a result, our designer offered a larger section that included not only events and news but also showed recent discussions on process topics based on the users' subscription or assignment to processes and past interactions.
After Eleken finished designing the prototype, it was ready to be shown to investors
As a result of our joint efforts, the client got a prototype of an enterprise solution with a simplified structure, clear logic, and consistent design. With its help, users can quickly and easily find any process details, discuss issues, create and share diagrams, and learn company updates or news.
Apart from that, our team also designed some convenient features that now fit seamlessly into the design, such as Flowchart Maker and Training Creator.
With the working prototype ready, our client can now present it to potential investors and partners as well as attract the first users.
Looking to design an intuitive prototype? Let us know if you need help, we will gladly offer our design expertise.