ClearPoint Strategy
Dashboard design for ClearPoint’s award-winning solution
As a rule, most dashboard software solutions are created by accountants and engineers. Being strategy, performance, and account managers, our clients asked themselves
What if we create a way for companies to capture the quantitative and qualitative information they need to make better decisions and optimize the experience to improve strategic planning, increase accountability, accelerate decision-making, and reduce time spent on manual reporting?
That was the moment when the ClearPoint Strategy solution was born.
ClearPoint Strategy is a SaaS strategy reporting tool used by leading organizations to automate and streamline their strategy reporting process. As of now, it is used by companies of all sizes and industries, including Fortune 500 companies, government agencies, banking & finance, and higher education.

But the existing dashboard creation feature needed breaking changes.
- The process of creating the community and public-facing dashboards was time-consuming and required effort from users.
- The dashboards had different styles and were neither easy to read nor pleasant to look at.
To rework and improve this feature, our client was looking for a UI/UX professional to help bring the dashboard template designs to a consistent look and feel, while preserving the existing structure and giving users the freedom to customize dashboards in a way they want.
Laying the foundation for project success from the trial period
At Eleken, our collaboration with clients usually begins with a 3-day free trial so that they can understand if we meet their requirements. This time, our designer worked on reworking and improving the logic of this screen, called the HTML Template.
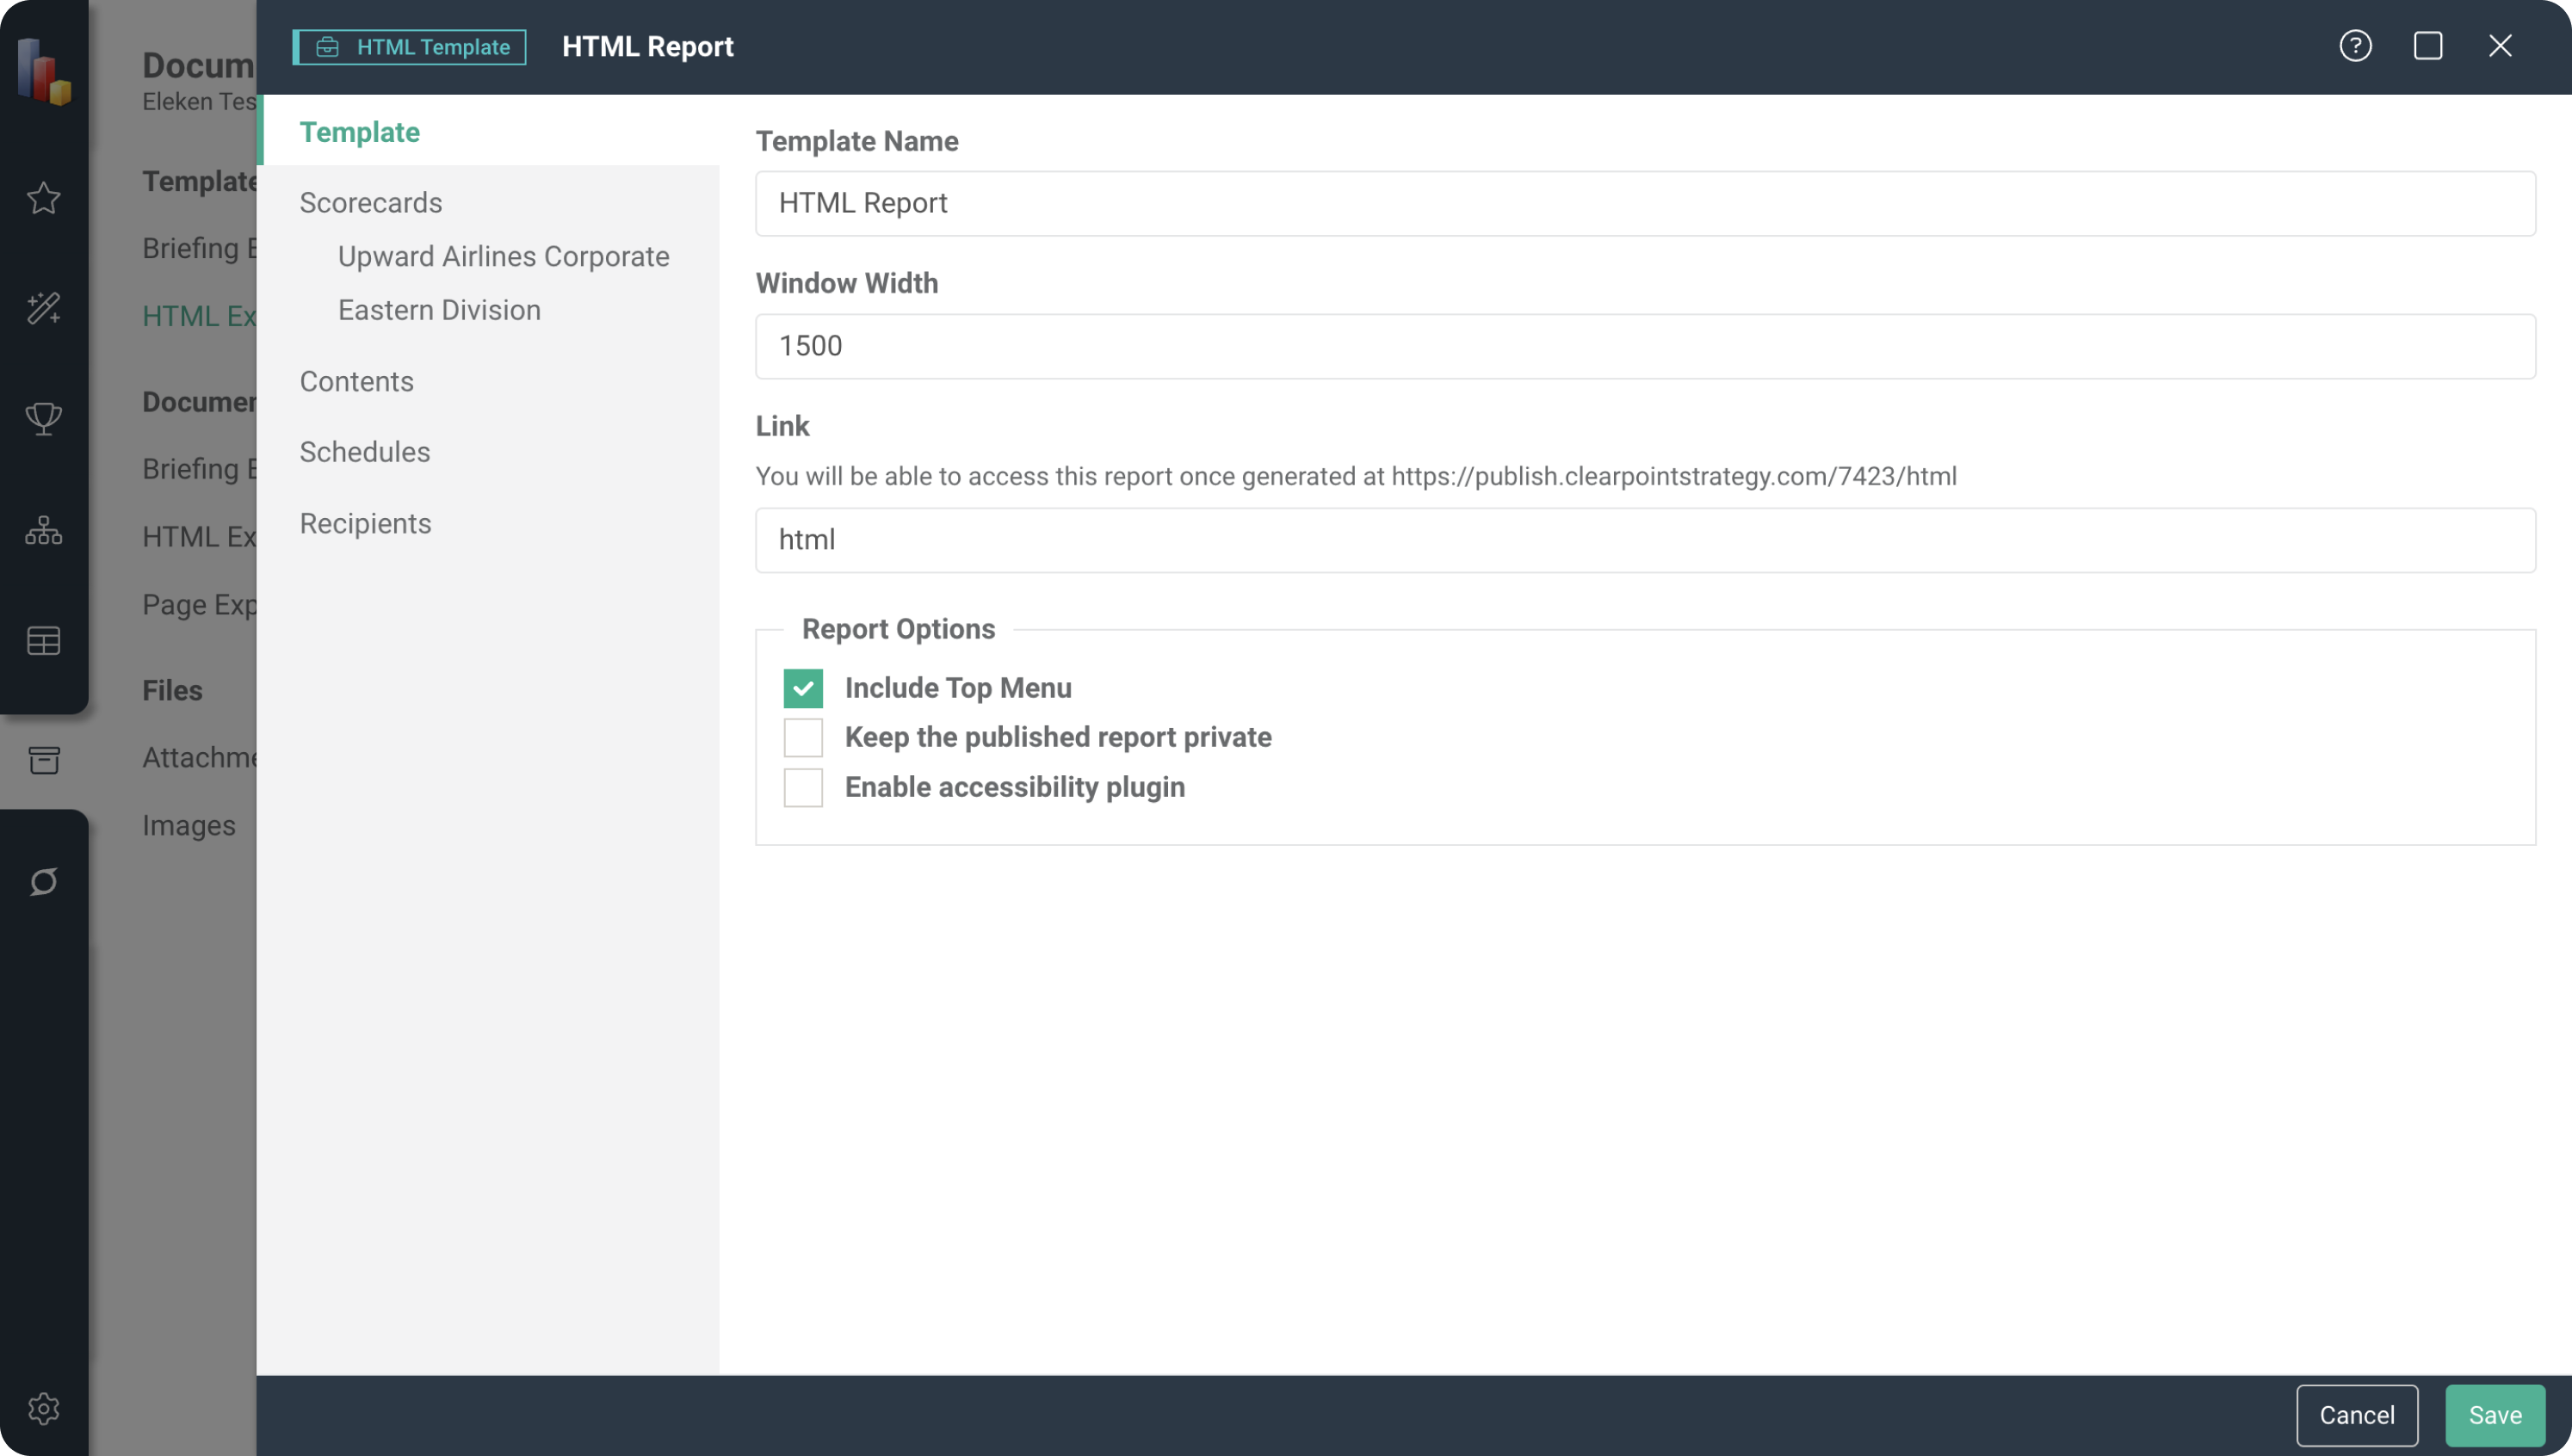
This HTML Template then became the basis for the future design of community and public-facing dashboards.
Overall, the trial included 2 stages:
- Intermediate results during trial.
In 2 days, our designer presented the first screen for dashboards, and the client shared the feedback.
- Final presentation
On the last day of the trial, we offered the primary version of the dashboard template with the content and customization sections. Here is what our client got after the trial:
How we designed ClearPoint Strategy’s unified dashboard template: 2 key stages
As the client was happy with the trial results, we continued working on the product design. We outlined the next steps in the design process and explained how our iterative process is organized. Also, we scheduled some calls and gathered more detailed information. It allowed us to prioritize tasks with the client’s team and gain a clear understanding of what to do first and what results are expected. Here is what was done.
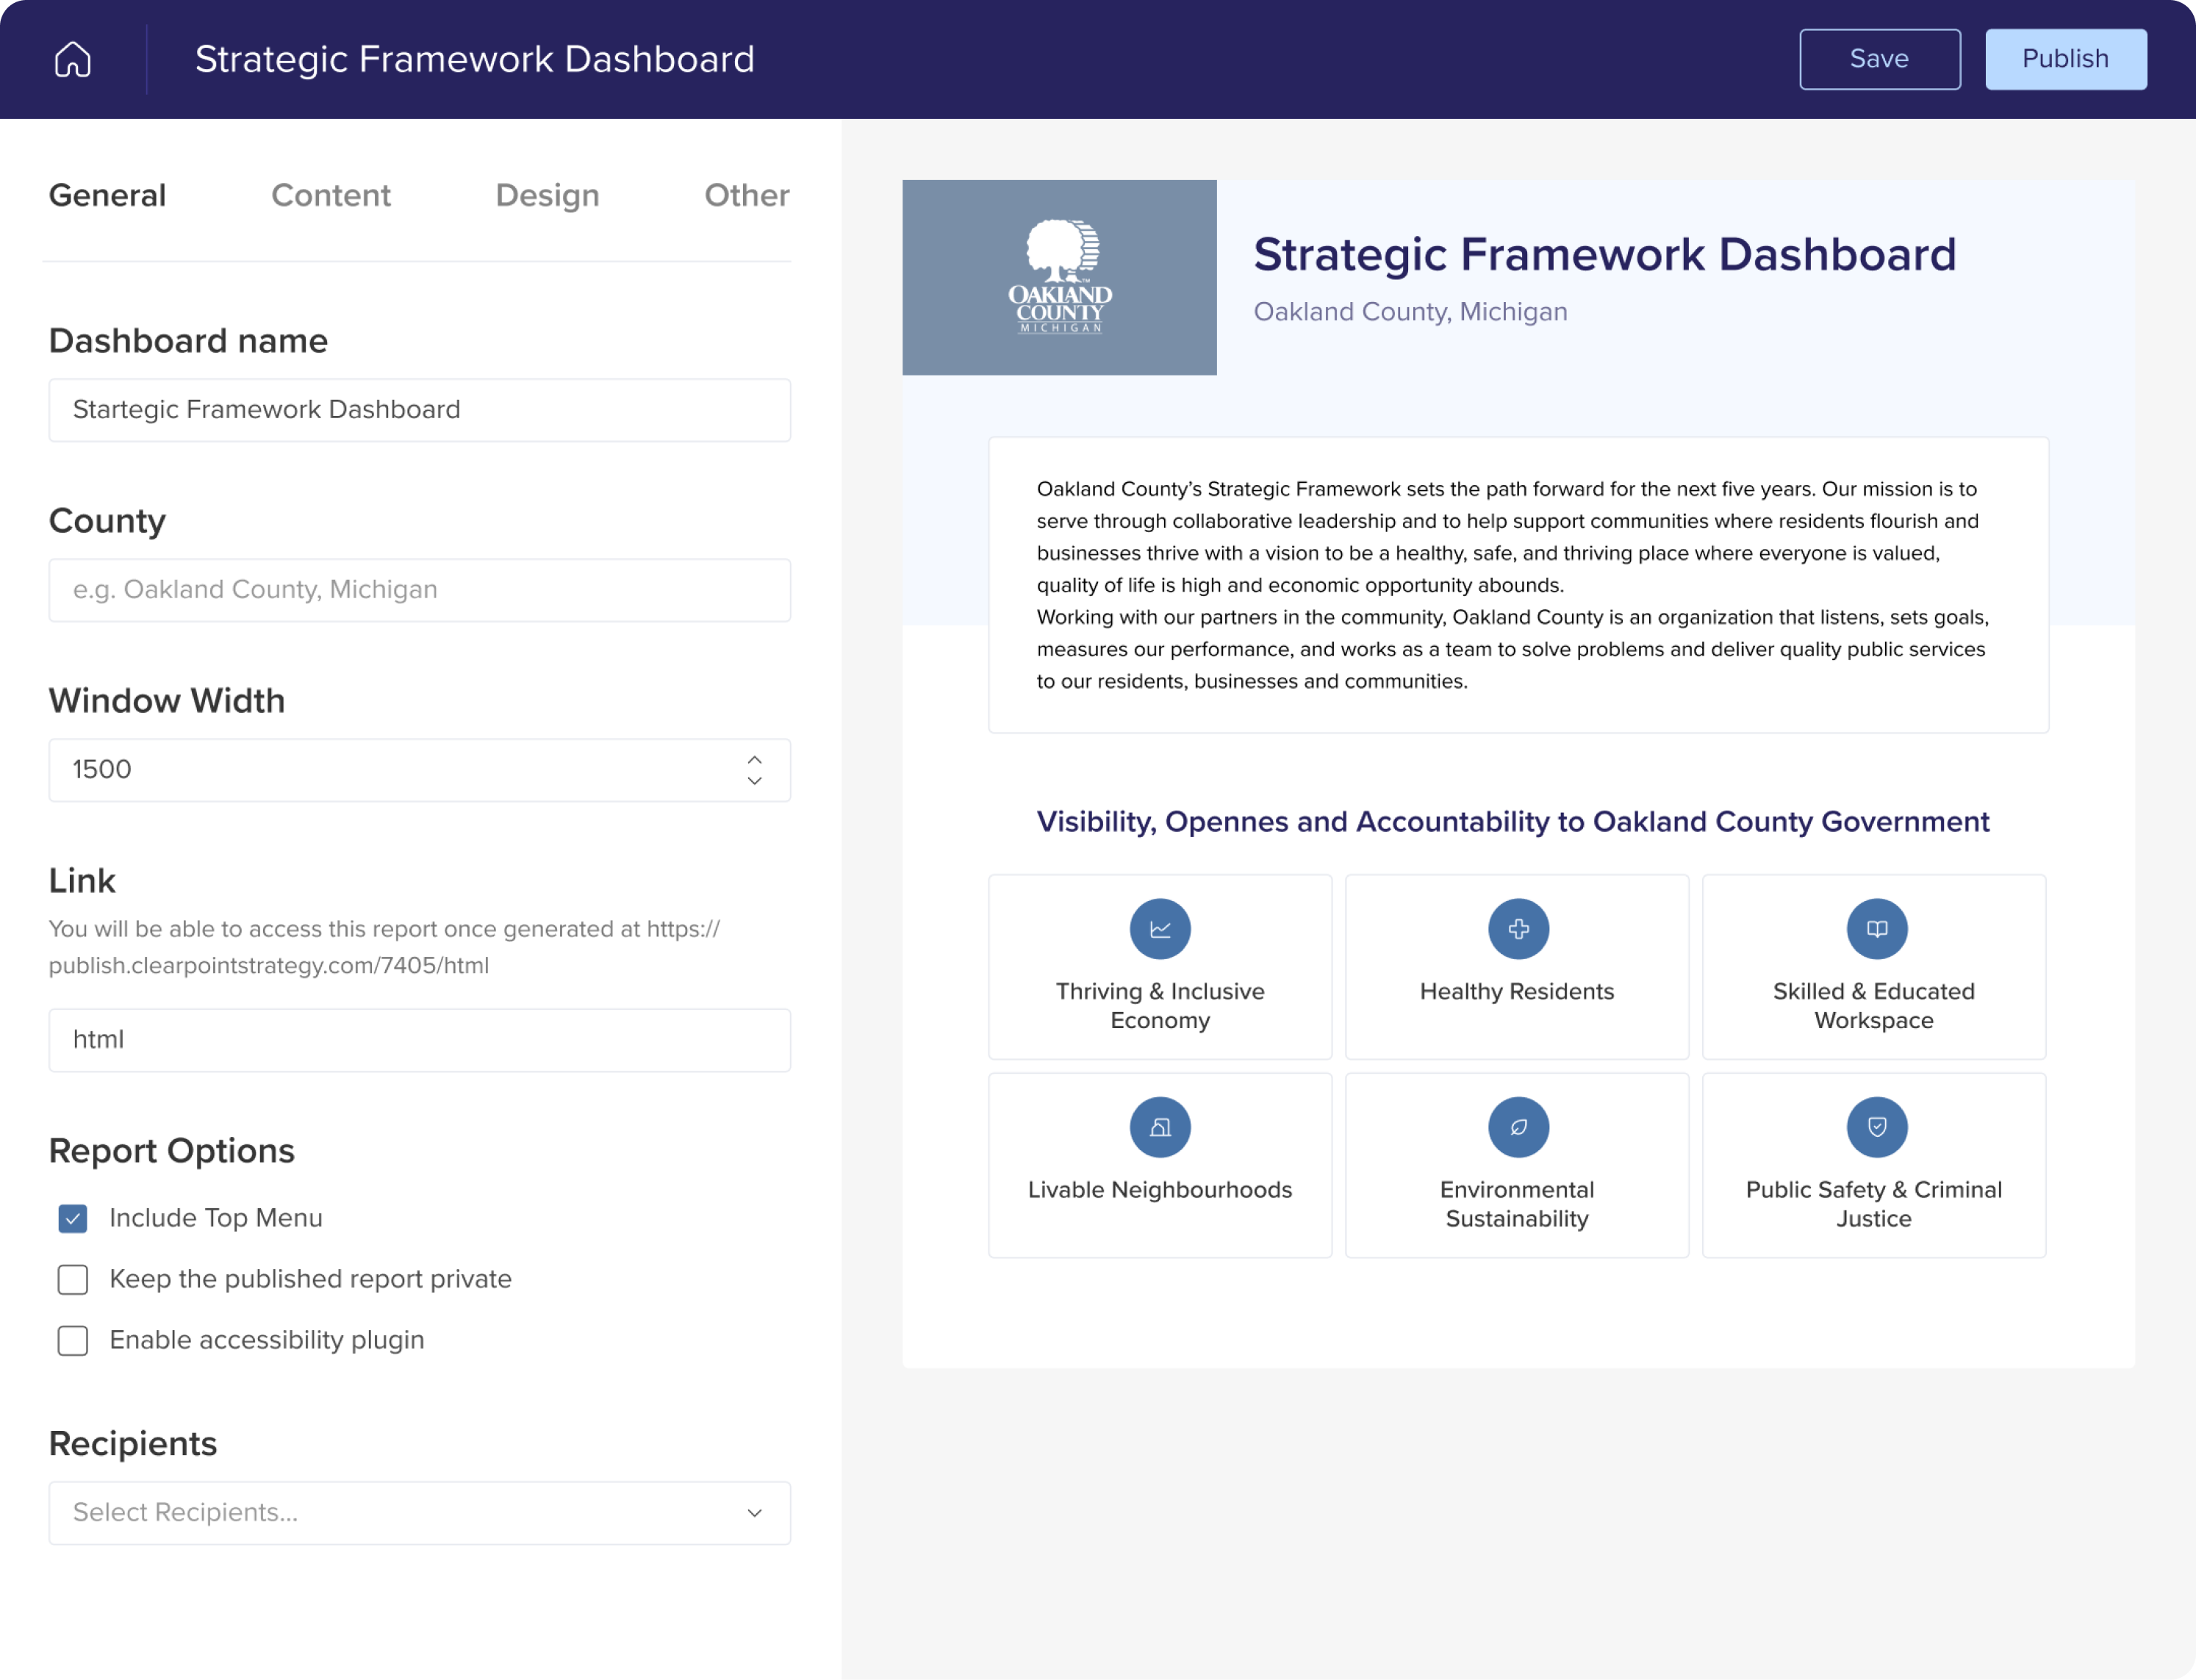
Step 1. Creating a template for community and public-facing dashboards
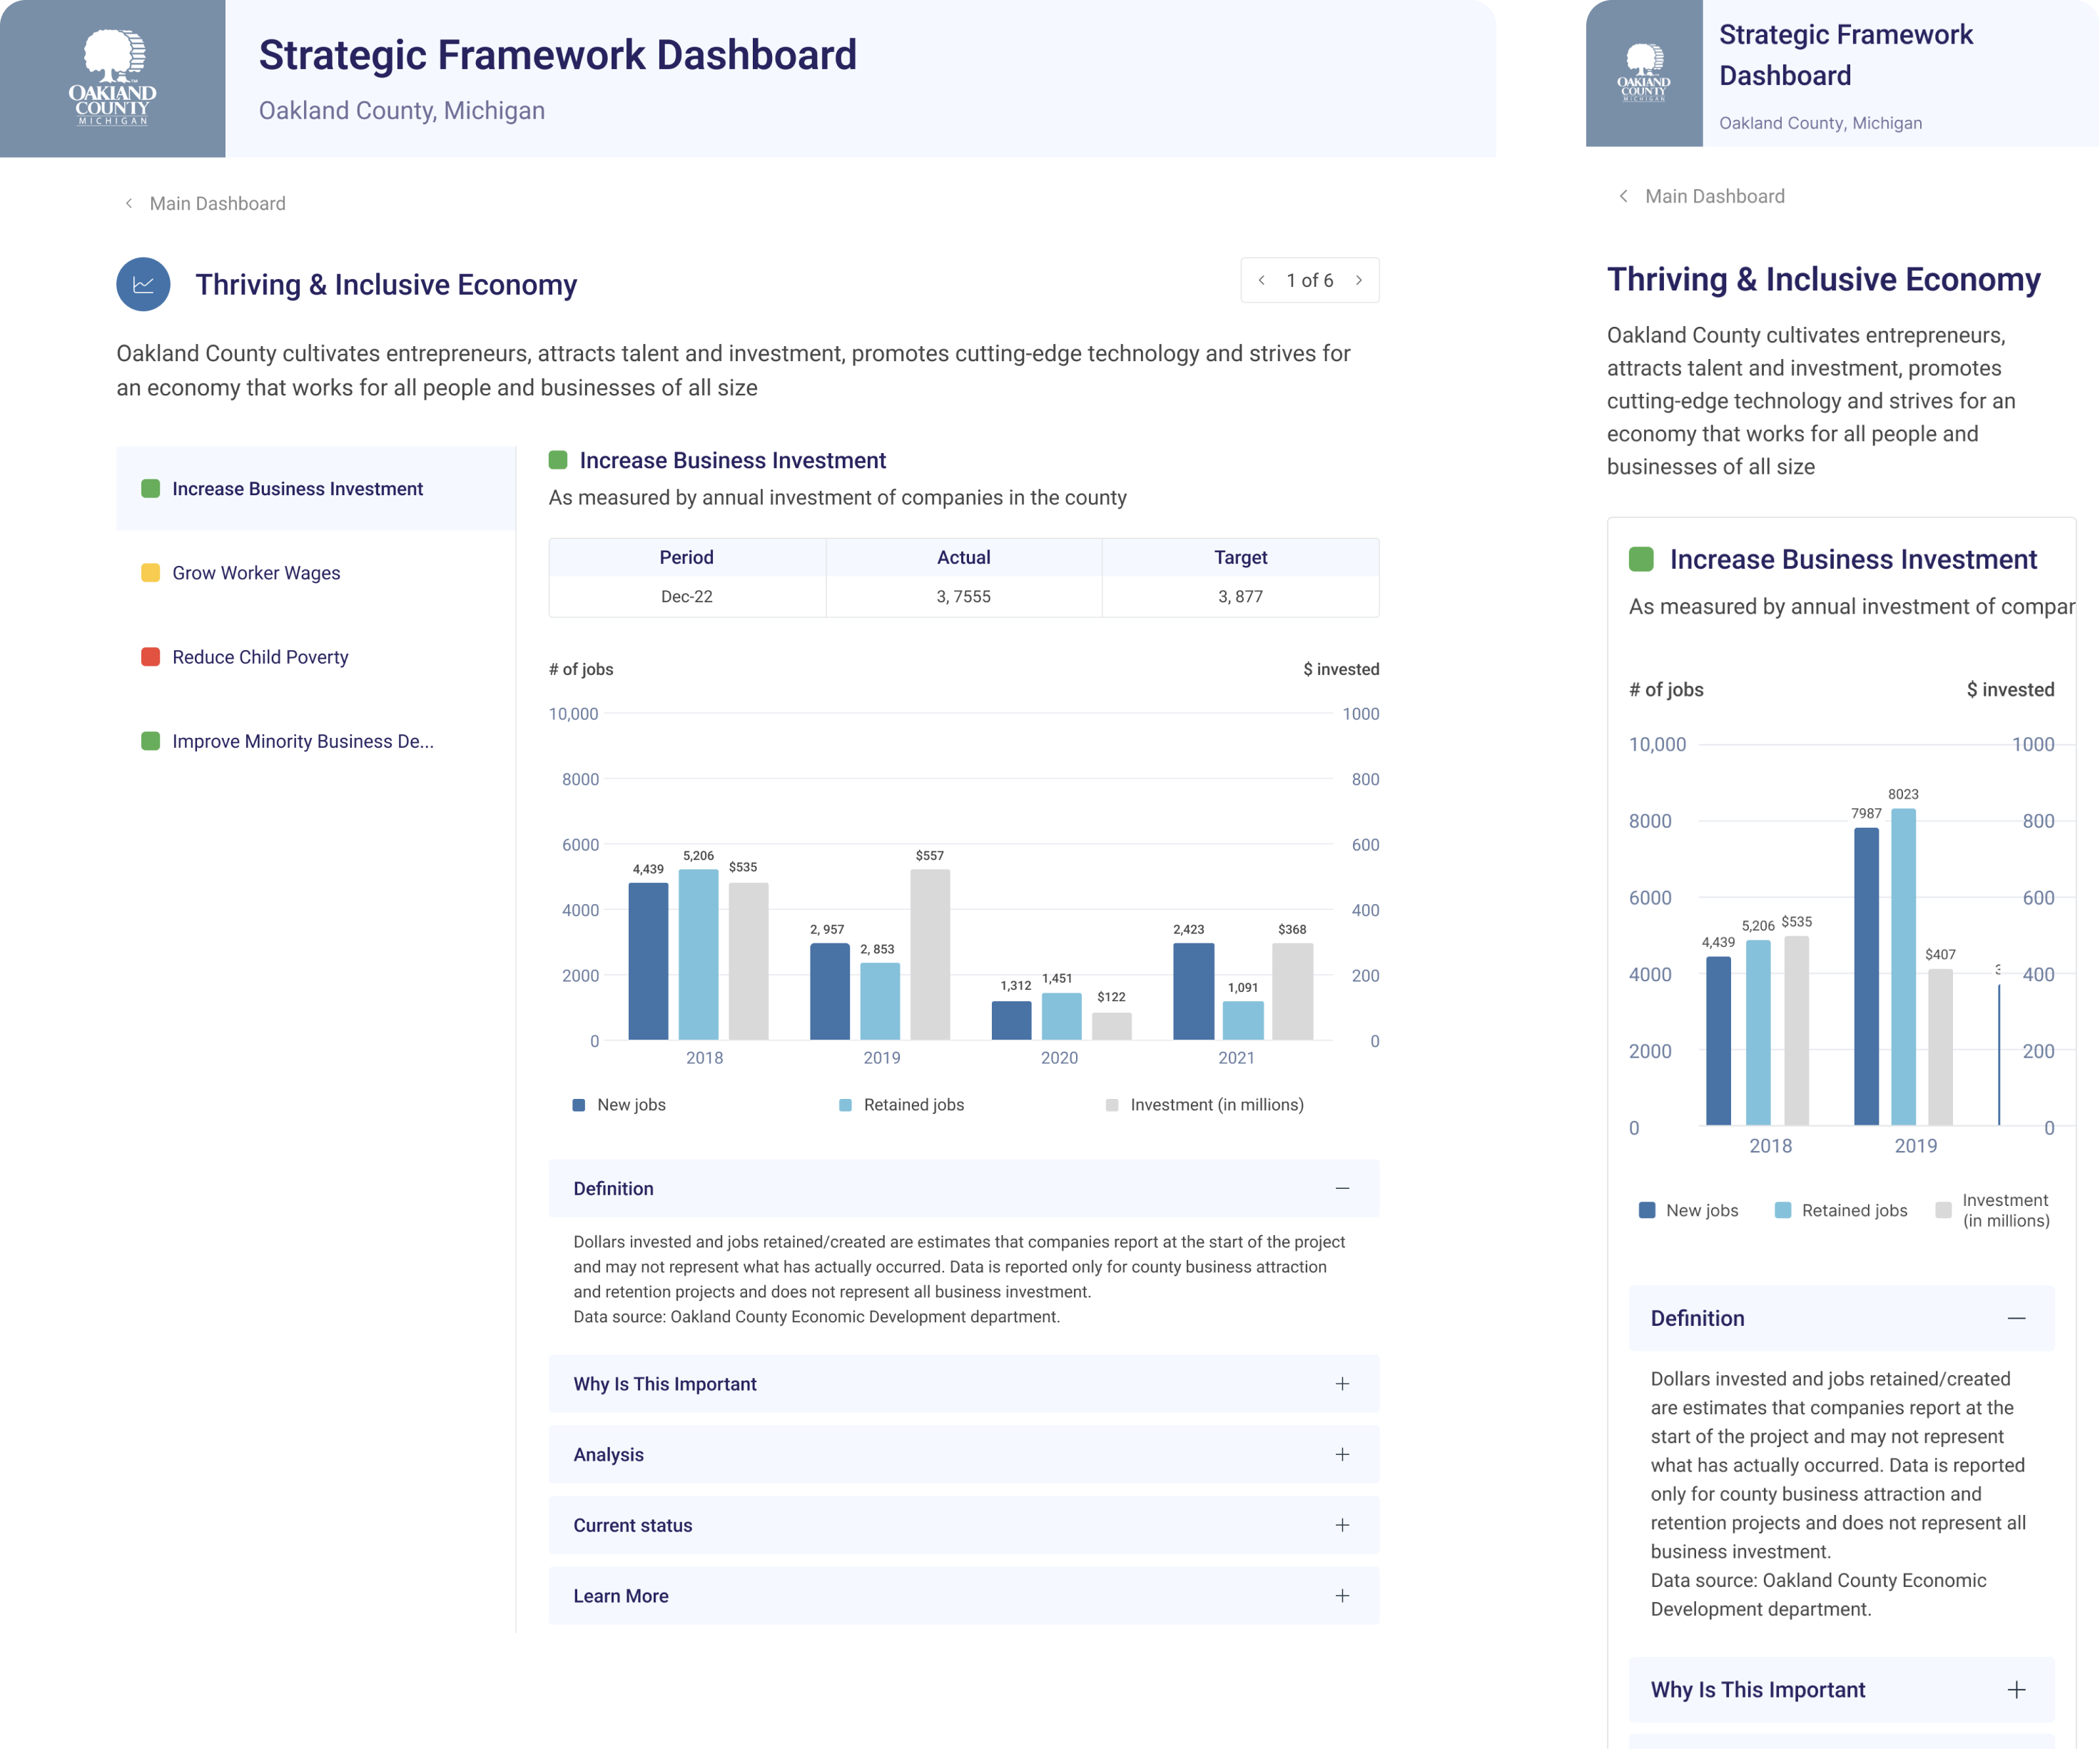
Our designer created one unified Dashboard Template that was easy to use and let users create minimal and easy-to-get public-facing dashboards.
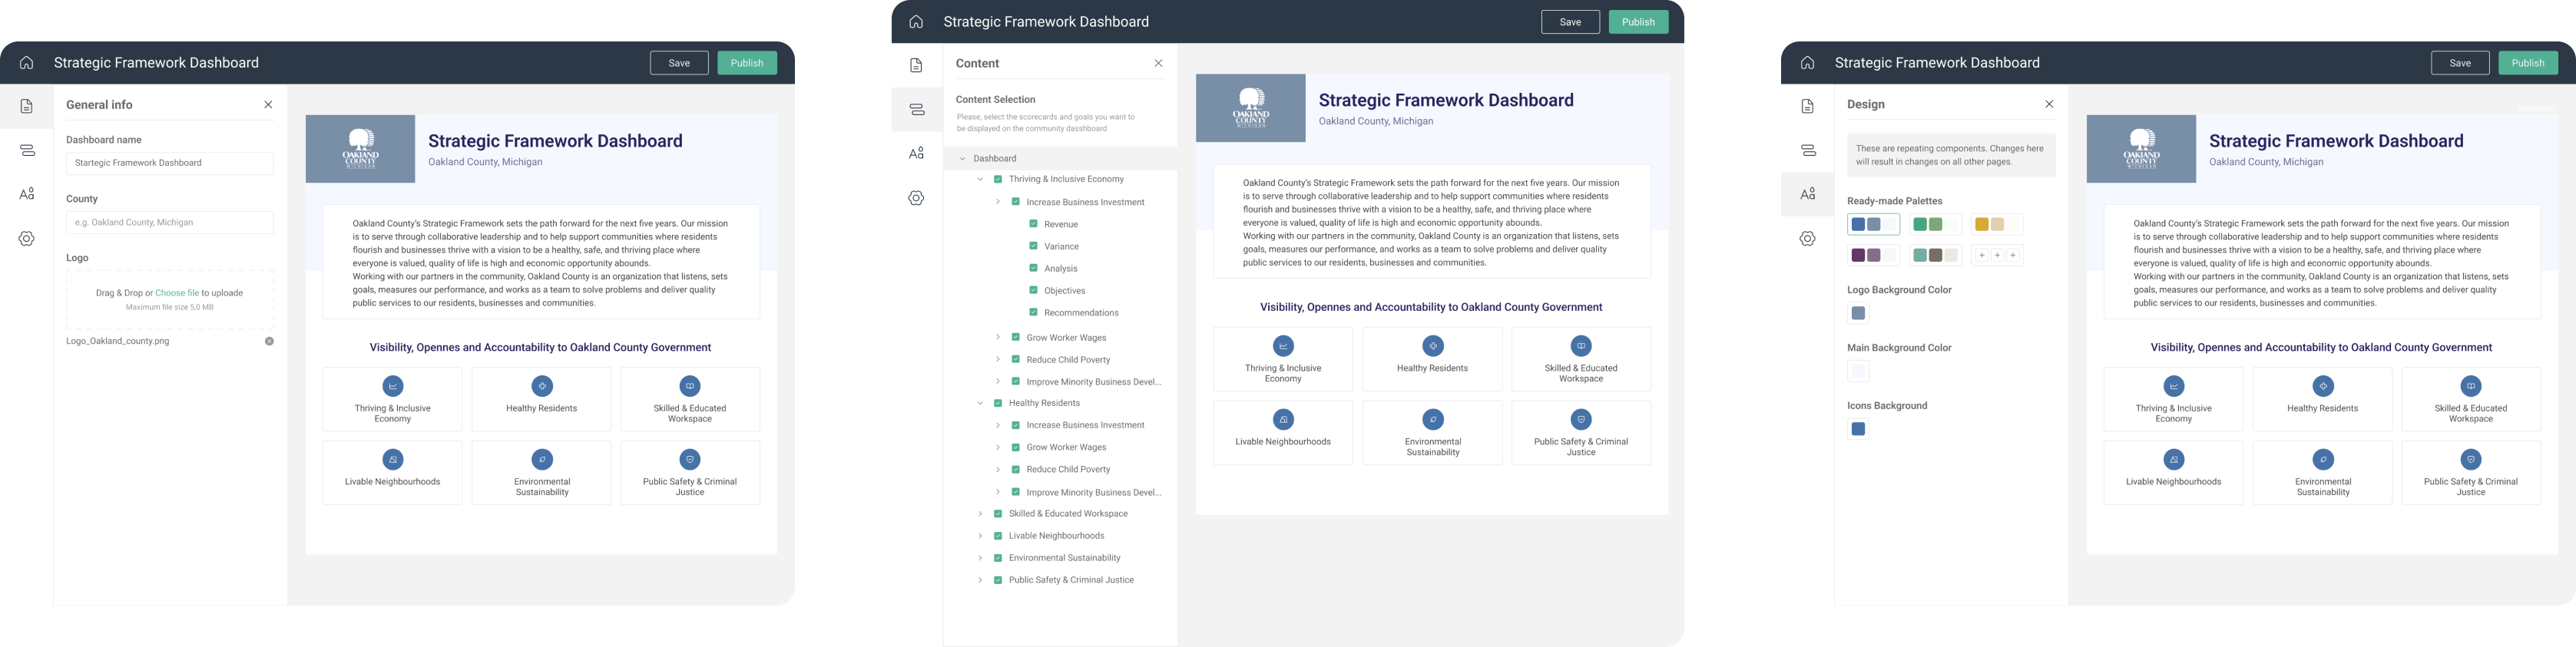
The Dashboard Template was divided into 4 clear sections:
- General settings: users can add the dashboard name, logo, and decide whether to make it public or private.
- Visual settings: users can choose a color palette, icons, and font in one click.
- Content choice: the content for the function was taken from already existing HTML Exports. Users can choose scorecards, measures, and graphs that will be displayed on the dashboards.
- Scheduling: users can schedule when to update or publish their dashboards.

Dividing the template into sections let us reduce the number of clicks made by users that will "read/view" it, as well as provide a clear and understandable process of creating a dashboard – users just need to navigate through the settings and change them to the desired configuration.
For users’ convenience, we also added the template preview function. Users can immediately see the in-app feedback when they change something and apply it. The dashboard pages are scaled to fit the preview in editing mode, while users can check how they will look on desktop and mobile devices.
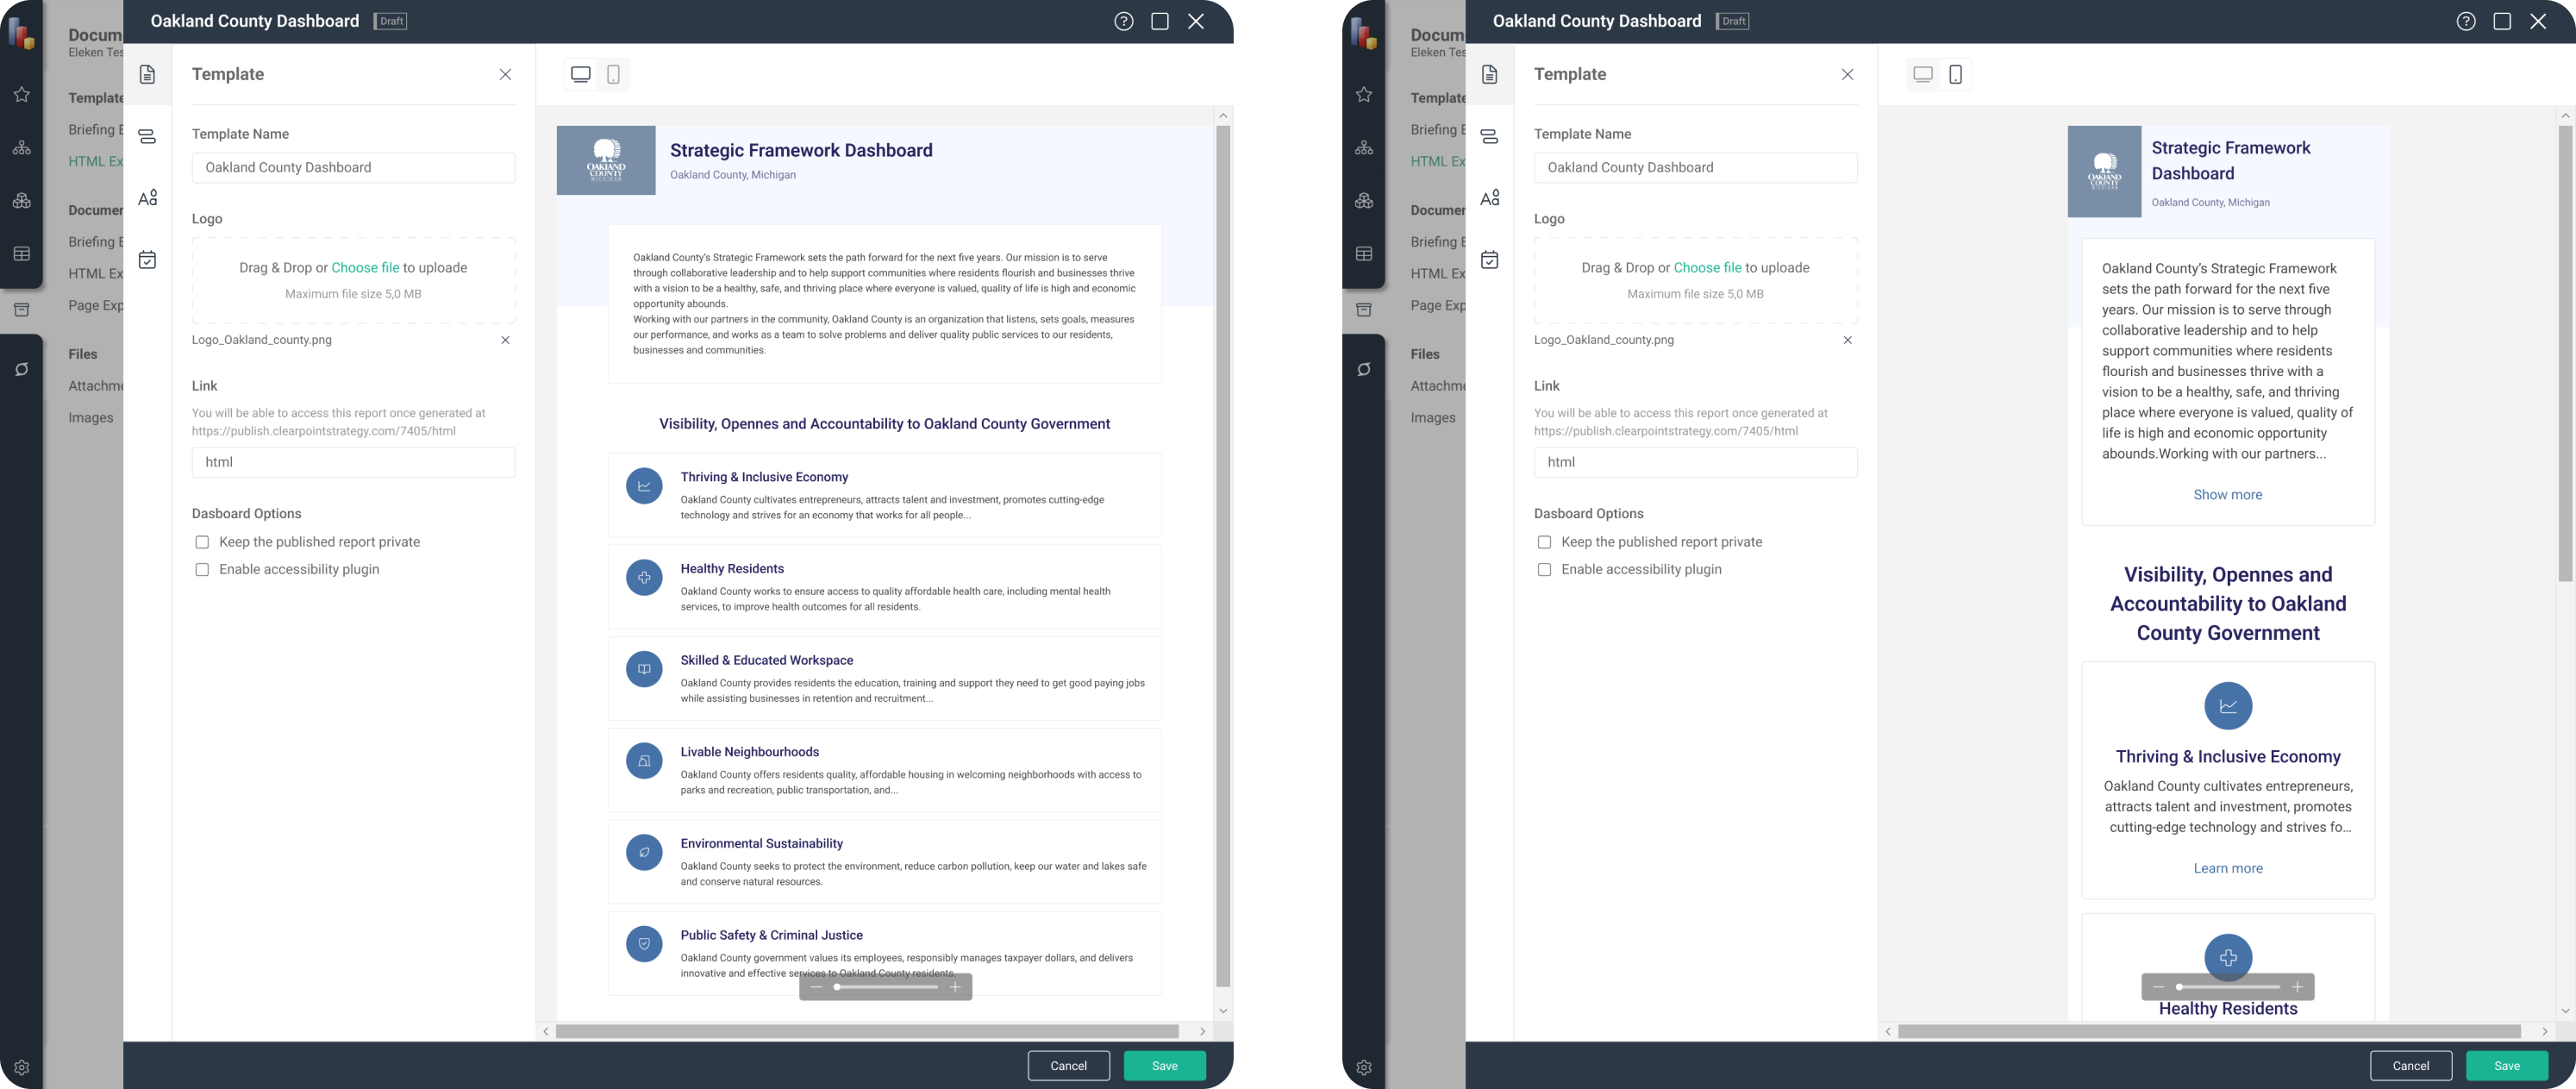
Once the template is configured, people will see the created dashboard when they visit a county website. The designs adapt to different screen sizes: for mobile and wider-screen devices. The dashboard graphs are scrollable, so they don’t look too condensed, and users can read the data even on smaller screens.
Step 2. Creating the guide for users and preparing design files for developers
During the final stage, our designers created an interactive guide that runs when a user opens the dashboard template for the first time. This guide provides a brief description of each tab with the actions users can perform when making the dashboard.

As the clients' developers had not yet started working with layouts, our designers' task was to cover as many user stories as possible and explain all the details in text mode. Therefore, the Eleken team created a separate file with comments for developers.
The new dashboard template looks visually pleasing and minimal, and "Loved" by users on G2
We had a great journey with ClearPoint Strategy. As a result of our cooperation, their clients got an appealing dashboard template with a consistent look, clean and minimal design, just what they were looking for.
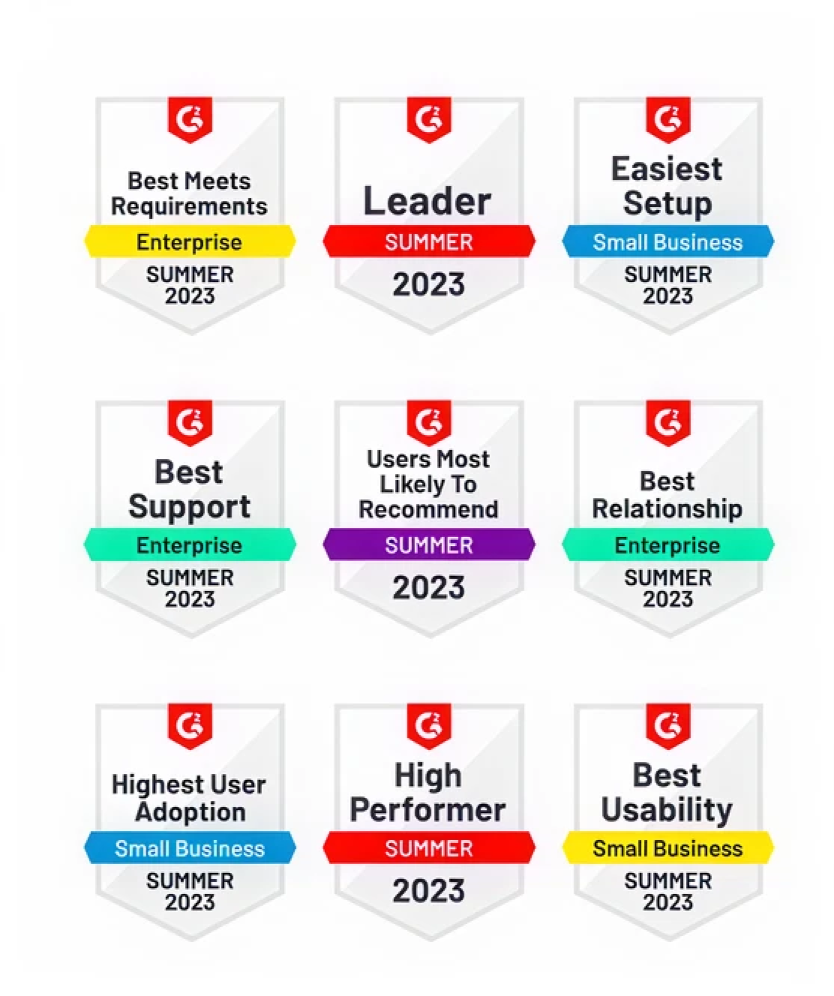
The company’s focus on great designs proved to be right as well. The Eleken team is delighted that ClearPoint Strategy has recently won the ‘Users Love Us’ badge by G2 in categories: Best Usability, Easiest Setup, Highest User Adoption, and more, which means their users are satisfied with the solution.
We also congratulate our clients on their outstanding achievements and receiving the Silver Stevie Award 2023 for Rebrand Experience of the Year.
And what is even more pleasing is that we have recently renewed our partnership, so the best is yet to come.
We have been extremely happy with their work. Not only did they provide good designs, but they could explain why they chose the designs and give us the research to show why a particular component should work the way they were suggesting. They also went above and beyond many times during the course of the engagement.
