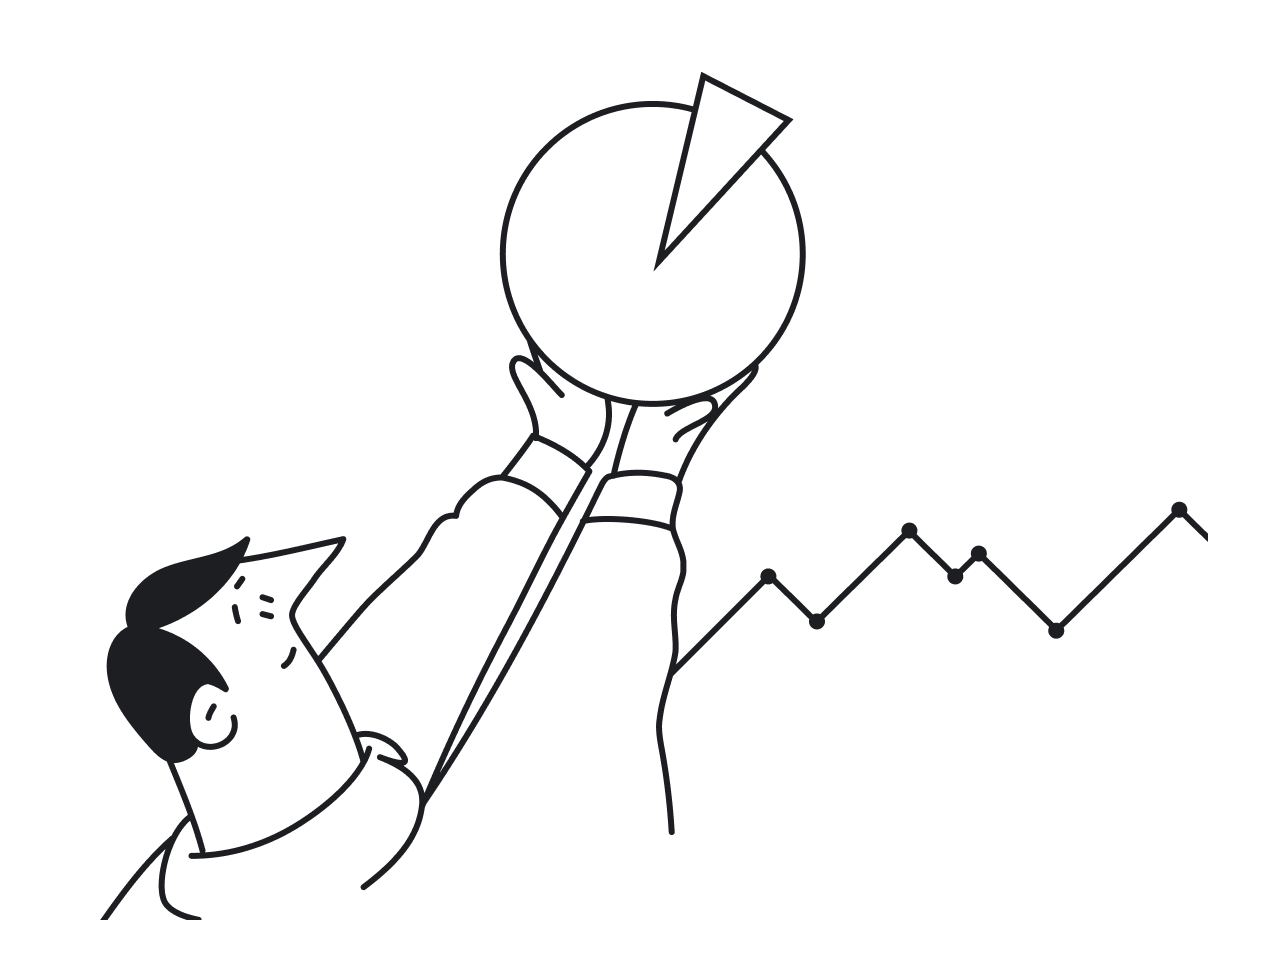
In the SaaS world, growth doesn’t come just from acquiring more users. It comes from keeping the ones you already have. That’s why churn and retention aren’t just vanity metrics. They’re vital signs of your product’s health.
Although often treated as two sides of the same coin, churn vs retention tells very different stories. Misunderstand either, and you risk investing heavily in acquisition while silently bleeding users out the back door.
At Eleken, we’ve seen this firsthand. SaaS companies come to us with problems like: “UX is too complex, onboarding sucks, and user engagement is under 10%.” In fact, most of the redesigns we take on are driven by high churn or poor retention.
So if you’re ready to stop guessing, start measuring, and actually solve churn with actionable strategies, this guide is what you’ve been looking for.

Why churn and retention matter in SaaS
Churn rate in SaaS is the quiet force that undermines product growth. You can bring in more users every month, but if too many slip away, your progress unravels. Retention isn’t just important — it’s what keeps your business from becoming a leaky bucket.
Here’s why these metrics are mission-critical:
- Retention improves your ROI on acquisition.
If you spend $100 to acquire a customer who pays $50/month, they must stay for two months to break even. If they churn after one, you lose money. Strong retention means clients stick around long enough to cover CAC and generate lifetime value.
- They’re key signals of product satisfaction and fit.
High churn often points to deeper issues — poor user onboarding, weak support, or a misaligned product. Retention shows your solution delivers value, and it’s one of the first metrics investors look at to assess product-market fit.
- They drive predictable recurring revenue.
When customers renew reliably, you can forecast growth, hire with confidence, and invest in features without fearing a revenue drop. That’s why retention metrics like net revenue retention (NRR) are so prized in SaaS.
As one expert put it, “There’s little point in acquiring new customers if churn is out of control.” Regardless of how impressive your top-of-funnel numbers look, your business won’t grow if you’re constantly losing the users you worked so hard to get.
So, before we talk about how to reduce SaaS churn or improve retention, let’s get clear on what these metrics actually mean.
What is churn rate in SaaS?
SaaS churn rate reflects how many customers stop using — or paying for — your product over time. It’s the percentage of people who cancel their subscription, don’t renew, or simply disappear. In short, churn shows you how fast you’re losing audience.
For SaaS companies, churn is a warning sign. A high rate tells you that something isn’t working: users aren’t seeing value, getting to their “aha” moment, or sticking around long enough for you to recoup what you spent to acquire them.

It can happen for many reasons. Sometimes customers leave voluntarily because your product didn’t meet their expectations or they’ve outgrown it. Other times, it’s involuntary — a failed payment, an expired credit card, or an unnoticed billing error.
While churn might seem like a normal part of running a subscription business (and to some extent, it is), ignoring it can quietly kill your growth. To keep a close eye on this, regularly using a churn rate calculator allows you to see exactly how much potential revenue is slipping through the cracks.
What is retention rate?
SaaS retention rates tell you the flip side of churn — how many of your customers are still actively using or paying for your product after a certain period of time. It’s a measure of loyalty, value delivery, and long-term product fit. This is a critical component of the AARRR SaaS metrics framework, specifically the "Retention" stage which feeds into "Referral" and "Revenue."
In SaaS, strong customer retention is the foundation of sustainable growth. It shows that users don’t stop at signing up. They’re sticking around, finding value, and building your product into their daily workflows. When you understand how to increase customer retention, you directly influence your MRR metric, ensuring that your monthly income grows through stability rather than just constant new acquisition.
Furthermore, keeping users longer significantly improves your long-term profitability. You can use an LTV calculator to see how even a small increase in retention time can exponentially grow the total value a single customer brings to your business over their lifetime.

When your SaaS customer retention rates are high, it means your product is doing its job: solving a real problem well enough that users don’t want to leave.
Investors and product teams often look at retention as a proxy for product value alignment. If your solution is truly essential to your users, they’ll keep coming back. If it’s not, your growth will always be shaky, no matter how good your go-to-market strategy is.
How to calculate churn and retention rates (with examples)
To calculate churn rate vs retention rate, you first need to decide whether you’re tracking customers or revenue. Both approaches are valid — it just depends on your business model and what insights you’re after.
Let’s start with customer churn. This is the percentage of customers who leave your product during a given time period. You calculate it using a simple formula:
.png)
For example, if you had 200 customers at the beginning of the month and 30 canceled, your churn rate would be (30 ÷ 200) × 100 = 15%. That means you lost 15% of your customers in a single month.
But sometimes, customer count doesn’t tell the whole story. That’s where revenue churn comes in. It looks at how much monthly recurring revenue (MRR) you’ve lost, which includes both cancellations and downgrades.
.png)
Suppose the initial MRR was $25,000, and you lost $3,000 due to customers canceling or switching to cheaper plans. The revenue churn would be (3,000 ÷ 25,000) × 100 = 12%. In this case, even if only a few customers left, the impact was still significant.
Now let’s switch to retention rate, which is basically the inverse of churn. The key here is to exclude new customers from the count. Otherwise, you won’t get a clear picture of how well you’re holding on to your existing base.
.png)
To put this into practice, imagine you had 80 customers on January 1st. By the end of the month, you have 65, but 10 of those are new. That means 55 of your original 80 customers stayed. Your retention rate would be (55 ÷ 80) × 100 = 68.75%.
You can also calculate revenue retention, using a similar idea — either as Gross Revenue Retention (GRR), which ignores upsells, or Net Revenue Retention (NRR), which includes them.
.png)
.png)
For instance, once you start the quarter with $100,000 in revenue and lose $5,000, your GRR is 95%. As soon as you gain $12,000 in expansion revenue, your NRR jumps to 107%.
💡 If you’re not a spreadsheet person, our team made it easier! You can use Eleken’s churn calculator, plug in your numbers, and get quick, clear results.
Industry benchmarks and what they really mean
So you’ve calculated your retention vs churn and faced the big question: Are my numbers good or bad?
The honest answer — it depends on your industry, business model, pricing, and stage of growth. But there are some general benchmarks that can help you understand where you stand.
According to Recurly, for established B2B SaaS companies, annual customer churn typically falls in the 5–7% range, which means annual retention of 93–95%. That’s considered strong. In monthly terms, this equates to roughly 1% churn or less. Maintaining these low rates is a primary driver of a high SaaS valuation, as it indicates a predictable and resilient revenue stream.
However, for early-stage startups, especially those still finding product-market fit, churn tends to be higher. It’s not unusual to see monthly churn in the 5–10% range during the first year or two, particularly in B2C or self-serve models where switching costs are low and users are quick to leave. If you find yourself in this high-growth but high-churn phase, balancing your financial KPIs for SaaS becomes a survival skill; you must ensure your growth rate is high enough to satisfy the rule of 40 despite the leaks in your bucket.
To improve these benchmarks, look closely at your product experience. By tracking UX design KPI examples such as "Time on Task" or "User Error Rate," you can pinpoint exactly where users lose interest. Improving these metrics delivers a measurable UX ROI, as a more intuitive interface directly lowers the churn spikes often seen in early-stage companies.

Among private B2B SaaS companies, SaaS Capital surveys show a median gross revenue retention of ~90% and a median NRR of ~102%. That means most companies are losing about 10% of their revenue annually before upsells, but gaining just enough from expansion to grow slightly.

Top-performing SaaS companies, however, take it much further. Best-in-class players — especially those serving enterprise customers — often achieve NRR above 120%. That’s what SaaS investor Jason Lemkin refers to as “net negative churn,” where upsells and renewals more than offset any losses.
During their growth peaks, Slack and Zoom both reported NRR in the 130%+ range — a strong signal that their existing customers were spending more over time.

Now, churn rate SaaS benchmarks can also vary by customer type. In general:
- B2C products (think consumer apps or streaming services) have higher churn, often because users don’t feel deeply tied to the product.
- SMBs churn more frequently than enterprises because they tend to have tighter budgets, less onboarding capacity, and sometimes shorter lifespans.
- Enterprise customers churn more slowly. As Jason Lemkin put it: “Big companies don’t churn — they quit you only if you really fail them.”
Going back to Recurly analysis, the average SaaS churn rate across all subscription businesses hovers around 4% per month, with roughly 3% voluntary and 1% involuntary. But this, too, varies wildly.
A B2B SaaS company with 5% monthly churn might be in panic mode, while a consumer box subscription business could see the same number as completely normal.

That’s why chasing an “industry average” is rarely useful. We recommend focusing on your own segment. Compare yourself to similar businesses with similar models — and more importantly, track your own progress.
If your annual retention today is 90%, your real goal is not to hit someone else’s benchmark — it’s to improve it. Can you raise it to 92%, then 95%? Those small gains compound over time, creating a huge impact on your revenue and customer lifetime value.
Visualizing user behavior through cohort, path analysis, and prediction models
Calculating retention rate vs churn rate is a solid start, but it only tells you what’s happening. To understand why users stay or leave, you need to look deeper. Tools like cohort analysis, path analysis, and prediction models can help you do this.
These methods help SaaS teams move beyond surface metrics and uncover the real patterns behind user behavior. In the next sections, we’ll walk through how they work and how to interpret the provided insights.
Cohort analysis
Cohort analysis is a tool for visualizing how retention evolves. Instead of treating all users as a single group, it lets you segment them by a shared attribute — most often, their signup date — and track how long they stay engaged with your product.

For example, you might group users who signed up in January, February, and March into separate cohorts. Then you measure how many from each group are still active after 7 days, 30 days, 90 days, and so on. The result is a cohort retention table revealing when users drop off and how behavior differs across groups.
This type of analysis is especially useful for spotting critical churn periods. You may find that a large percentage of users leave within the first week, but those who stay past that point tend to stick around for much longer. That insight alone can tell you exactly where to focus your further efforts.
It also helps you evaluate product changes.
Suppose you rolled out a new onboarding flow in March. If users from that month show higher 30-day retention than those from February, you’ve got evidence that the change worked.
Path analysis
If cohort analysis shows you when churn happens, path analysis helps you understand why. It maps the steps users take inside your product, especially those who leave, and reveals the behavioral patterns that often signal churn is coming.

Path analysis typically works in reverse. You start with the moment of cancellation and look backward to see what led up to it. What was the user’s last interaction? Which features did they ignore? How did their engagement change over time?
Often, there are clear signals. For example, you might discover that users who churned never activated a core feature, or stopped logging in three weeks before cancellation. These small details are red flags hiding in plain sight.
One great example is Groove, a helpdesk SaaS tool.
Their team found that churned users had first sessions averaging 35 seconds, compared to 3 minutes for retained ones. They also logged in far less frequently — 0.3 times per day vs. 4.4 times per day for engaged users.

Based on those insights, Groove set up trigger-based emails for users showing early signs of disengagement, like short sessions or lack of logins. The result was a 71% reduction in SaaS churn rates.
The path analysis lets you identify “danger zones” in your SaaS customer journey and steer users toward success. If you know, for instance, that a user who hasn’t logged in for 14 days is likely to churn, you can trigger an in-app message or email on day 10.
The key is timing — catching users before they’ve mentally checked out.
Churn prediction models
Some SaaS companies take it further by relying on predictive analytics to calculate churn risk scores based on these usage patterns. Two popular approaches are used most often: logistic regression and survival analysis.
1. Logistic regression, or classification modeling, is a statistical method used to predict binary outcomes, in this case, churn vs renewal.

You feed the model a large dataset of customer behaviors and attributes: product usage metrics, login frequency, team size, NPS scores, support ticket history, and more. The model identifies which factors strongly correlate with churn and assigns each user a churn risk score.
For example, it might reveal that customers who don’t upload any data in their first 7 days are 3x more likely to churn, or that small teams (1–2 users) churn at a much higher rate than larger ones.
In essence, it’s a more quantitative, scalable extension of path analysis — one that weighs multiple variables at once to predict churn likelihood.
2. Survival analysis, borrowed from medical and actuarial statistics, estimates how long a customer is likely to stay and when they’re most likely to churn.

Rather than predicting yes/no outcomes, it models the time until churn and accounts for “censored” data (users who haven’t churned yet but are still at risk).
A survival curve might show, for example, that 60% of users stay past 12 months, and those who make it past 24 months are likely to remain for years. Or it might highlight a steep drop-off in the first 30 days, telling you exactly where to invest in onboarding improvements.
Some companies even use survival models to simulate changes, like estimating how a 10% improvement in early onboarding could boost average customer lifetime and revenue. This modeling is a sophisticated way to manage your SaaS financial KPIs, ensuring you aren't just reacting to past data but predicting future stability.
Strategies to reduce churn and boost retention (actionable tactics)
Once you understand churn, customer retention, and where users fall off, the next step is action. Mastering your SaaS metrics allows you to move from observation to optimization.
Successful SaaS companies employ a mix of product, customer success, and marketing strategies to systematically improve SaaS customer retention. Below, we’ve collected a structured list of practical tips you can start implementing today:
- Nail the onboarding and “aha!” moment.
First impressions shape retention. If new users don’t quickly see the value in your product, they won’t stick around long enough to change their minds. That’s why onboarding needs to guide users toward your product’s activation milestone. To justify the budget for these improvements, use a CAC calculator to see how much you save by converting a trial user into a long-term customer. If you want to study the theory behind this, some of the best books on SaaS metrics emphasize that the cost of a failed onboarding (your CAC SaaS) is the biggest hidden drain on any SaaS business model.
Integrating these tactics into your SaaS business model canvas helps you see how better onboarding strengthens your "Customer Relationships" and stabilizes the overall your business model.

- Segment your users and personalize engagement.
Not every customer is the same, and your retention efforts shouldn’t be either. Segment your users by plan tier, activity level, company size, and lifecycle stage, and tailor your communication accordingly.

- Provide proactive support and education.
In-app help centers, contextual tooltips, and guided walkthroughs reduce frustration and increase user confidence. An even better move — and a key principle of effective SaaS customer success — is to watch for early warning signs and reach out.

- Offer flexibility to prevent cancellations.
When someone hits the “cancel” button, let them pause the subscription, downgrade to a lighter plan, or offer a short-term discount. Just be careful and avoid aggressive tactics that make users feel trapped.
.png)
- Improve UX and remove friction.
It doesn’t matter how powerful your product is if users can’t figure out how to use it. Small usability issues, confusing interfaces, or bugs can quickly drive people away. That’s why reducing friction is one of the lowest-effort ways to fix ux issues.

- Gather feedback and close the loop.
Surveys, exit polls, and NPS prompts are great, but only if you act on them. If users say onboarding was confusing or a feature is missing, let them know you’re listening. Acknowledge pain points, share fixes, or explain workarounds.

- Reduce involuntary churn (payment failures).
Almost half of churn can come from people who didn’t want to leave but did because of a billing issue. To avoid this, implement a smart dunning process: send reminders, retry payments on multiple days, and enable automatic card updates.

What design has to do with churn (and how Eleken helps)
After analyzing SaaS metrics, mapping user behavior, and experimenting with strategies, many SaaS teams arrive at the same realization:
The product’s UX is holding people back.
At Eleken, we often see this problem. 94% of the SaaS product design projects we take on are driven by low customer retention vs churn. Users just don’t stick because the product doesn’t feel intuitive, engaging, or easy to adopt.
We’ve heard the same issues again and again:
“UX is not great, and our bounce rate is extremely high — nearly 89%.”
“We’ve got over 40,000 users, but less than 10% engage with the product.”
“The onboarding is confusing. Journeys are unclear. Everything feels too complex.”
When users don’t understand the product — or worse, feel overwhelmed by it — no amount of lifecycle emails or retention nudges can help. That’s why we treat design as a core part of our retention strategy.

Let’s take a look at the case of myInterview. Their onboarding experience was leading to massive drop-off rates. We redesigned it from the ground up, making the first-time experience clearer, faster, and easier to navigate.
After all, our design work always has one goal: to help users succeed faster and stick around longer. Because at the end of the day, if your product is hard to use, it will be hard to grow.
Wrap up
You don’t need another SaaS dashboard telling you that the churn is up. You already know something’s off. Users sign up, poke around, maybe come back once, and then are gone. You’ve shipped features, sent emails, and tweaked pricing. Still, the numbers flatline.
This isn’t a marketing problem. It’s not a sales problem. It’s a product experience problem.
Most teams wait too long to admit that. They measure, analyze, segment… but never really look at the product through a new user’s eyes. They don’t see the dead ends. The friction. The decisions that made sense in a sprint break everything in the real world.
Fix that, and everything else gets easier — onboarding process, product adoption, and expansion. Growth, the sustainable kind, starts with people actually using what you’ve built.
Our Eleken team helps SaaS teams rebuild the parts of their product that users are quietly slipping away from. And we do it fast.