
You have users signing up, people clicking around your product promising signs that it resonates – and yet, revenue feels stuck.
This is one of the most common – and most uncomfortable – moments in building a product in the SaaS industry. You’re clearly attracting interest, but the numbers aren’t lining up with your sales and marketing efforts. So naturally, you start googling things like “average SaaS conversion rates” or “what is a good SaaS conversion rate?”, hoping for a clear answer.
What you usually find instead is a list of percentages with very little context. Numbers like “3–5% is good” get repeated often, but without explaining good for whom, at what stage, and under which conditions they often create more anxiety than clarity — especially when compared with generic conversion benchmarks or vague industry standards.
The truth is: SaaS conversion rates are signals, not grades. They don’t tell you whether you’re “good” or “bad” in isolation. They tell a story – about your stage, your users, your pricing model, and how clearly people reach value inside your product.
So instead of chasing generic numbers, let’s break down:
- what SaaS conversion rates really mean (beyond surface-level SaaS metrics)
- realistic benchmarks with context, not judgment
- how to interpret your own conversion funnel without panicking
- and how strong SaaS companies improve conversions without chasing the wrong metrics.
If you’re a SaaS founder or marketer trying to make sense of your conversion data – not just optimize it blindly – you’re in the right place.
Understanding SaaS conversion rates (+ funnel-based breakdown)
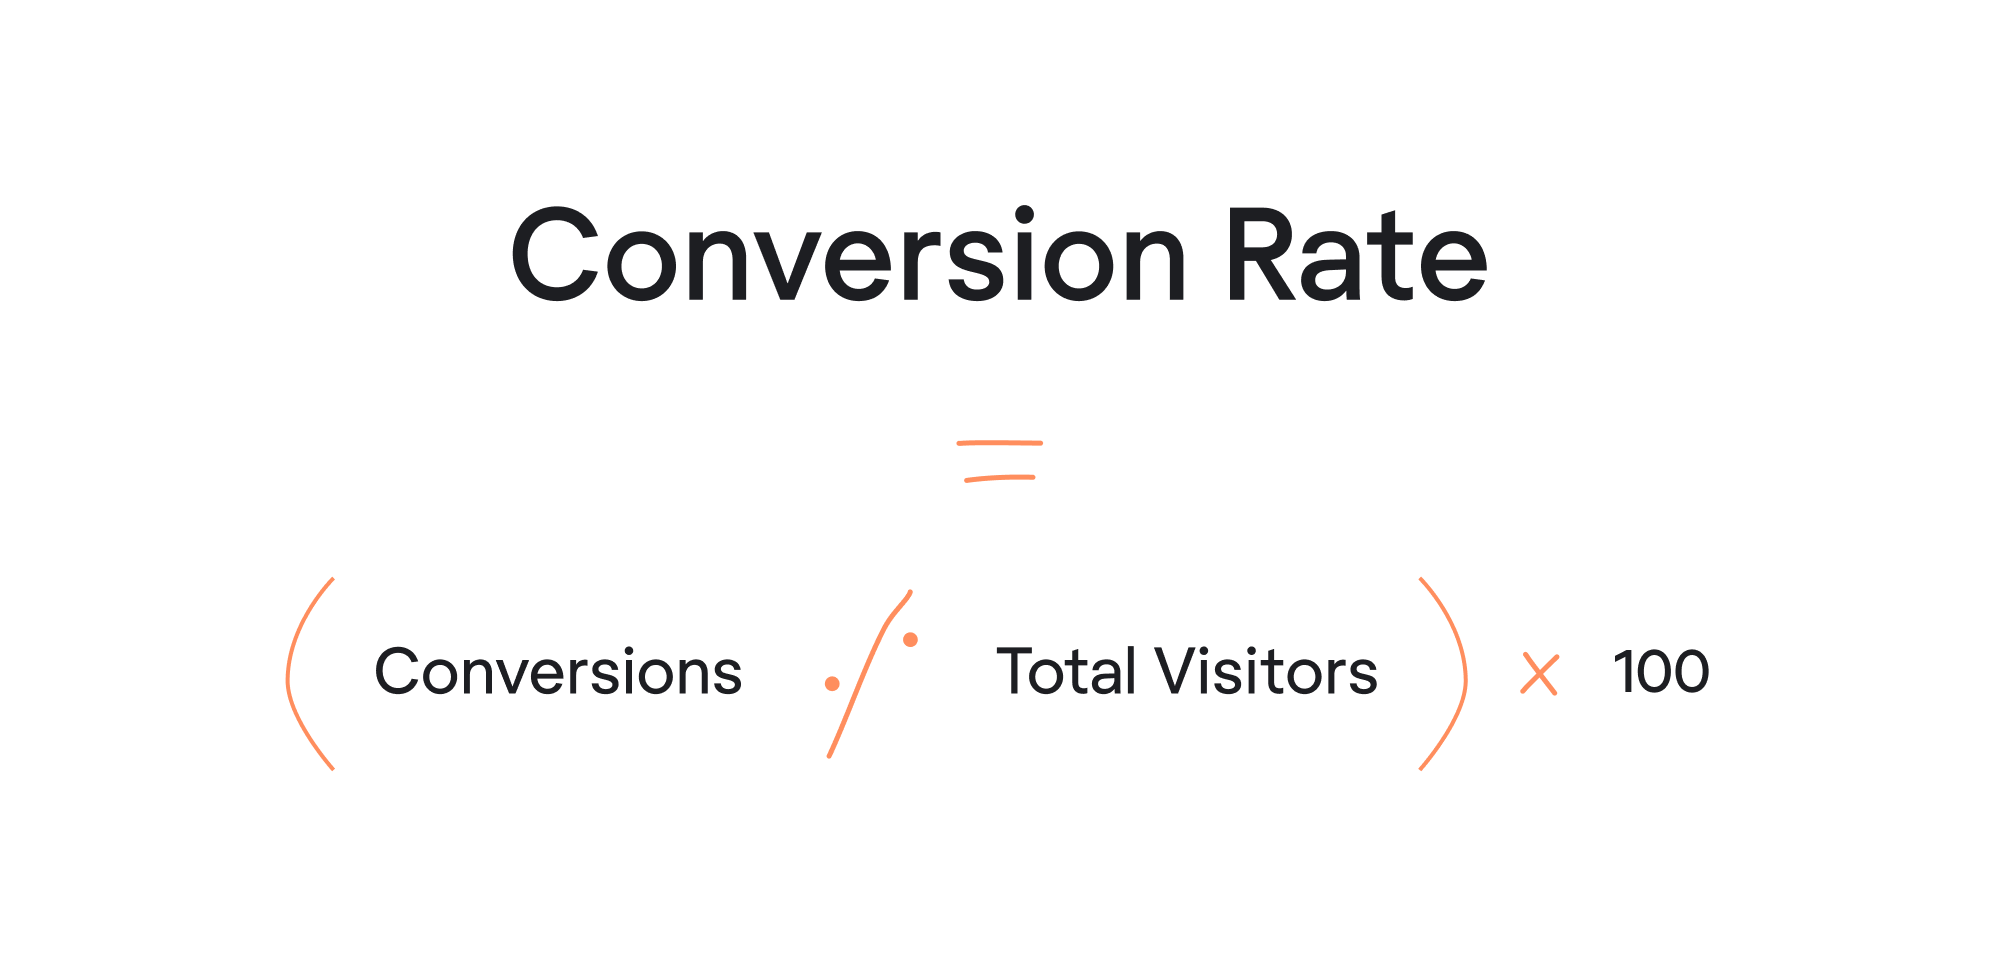
At its simplest, a SaaS conversion rate measures the percentage of users who move from one meaningful stage of the funnel to the next during a specific period. In essence, teams measure conversion rates to understand how effectively users move through the marketing funnel and sales funnel.
Unlike e-commerce, where conversion usually means visitor → purchase, SaaS products have longer customer journeys and more decision points. For that reason, users typically move through a series of micro-conversions, each one signaling progress – or friction– in the product journey.
These micro-conversions map to different key stages of the conversion funnel. Those stages vary by product and business model, but most SaaS funnels include some version of the following:
- visitor → new user (signup)
The signup conversion reflects whether a website visitor decides to sign up after landing on your site. At this stage, the goal is to convert visitors by presenting a clear value proposition and removing friction from the sign up form.
This step is strongly influenced by landing pages, messaging, and overall marketing strategy.
- created account → activated
Activation happens when users reach their first meaningful value moment, such as sending a campaign, connecting a data source, or inviting teammates.
This stage helps teams track conversion rates between early engagement and meaningful product interaction. Improving activation often requires a deep understanding of user pain points and how the product solves them.
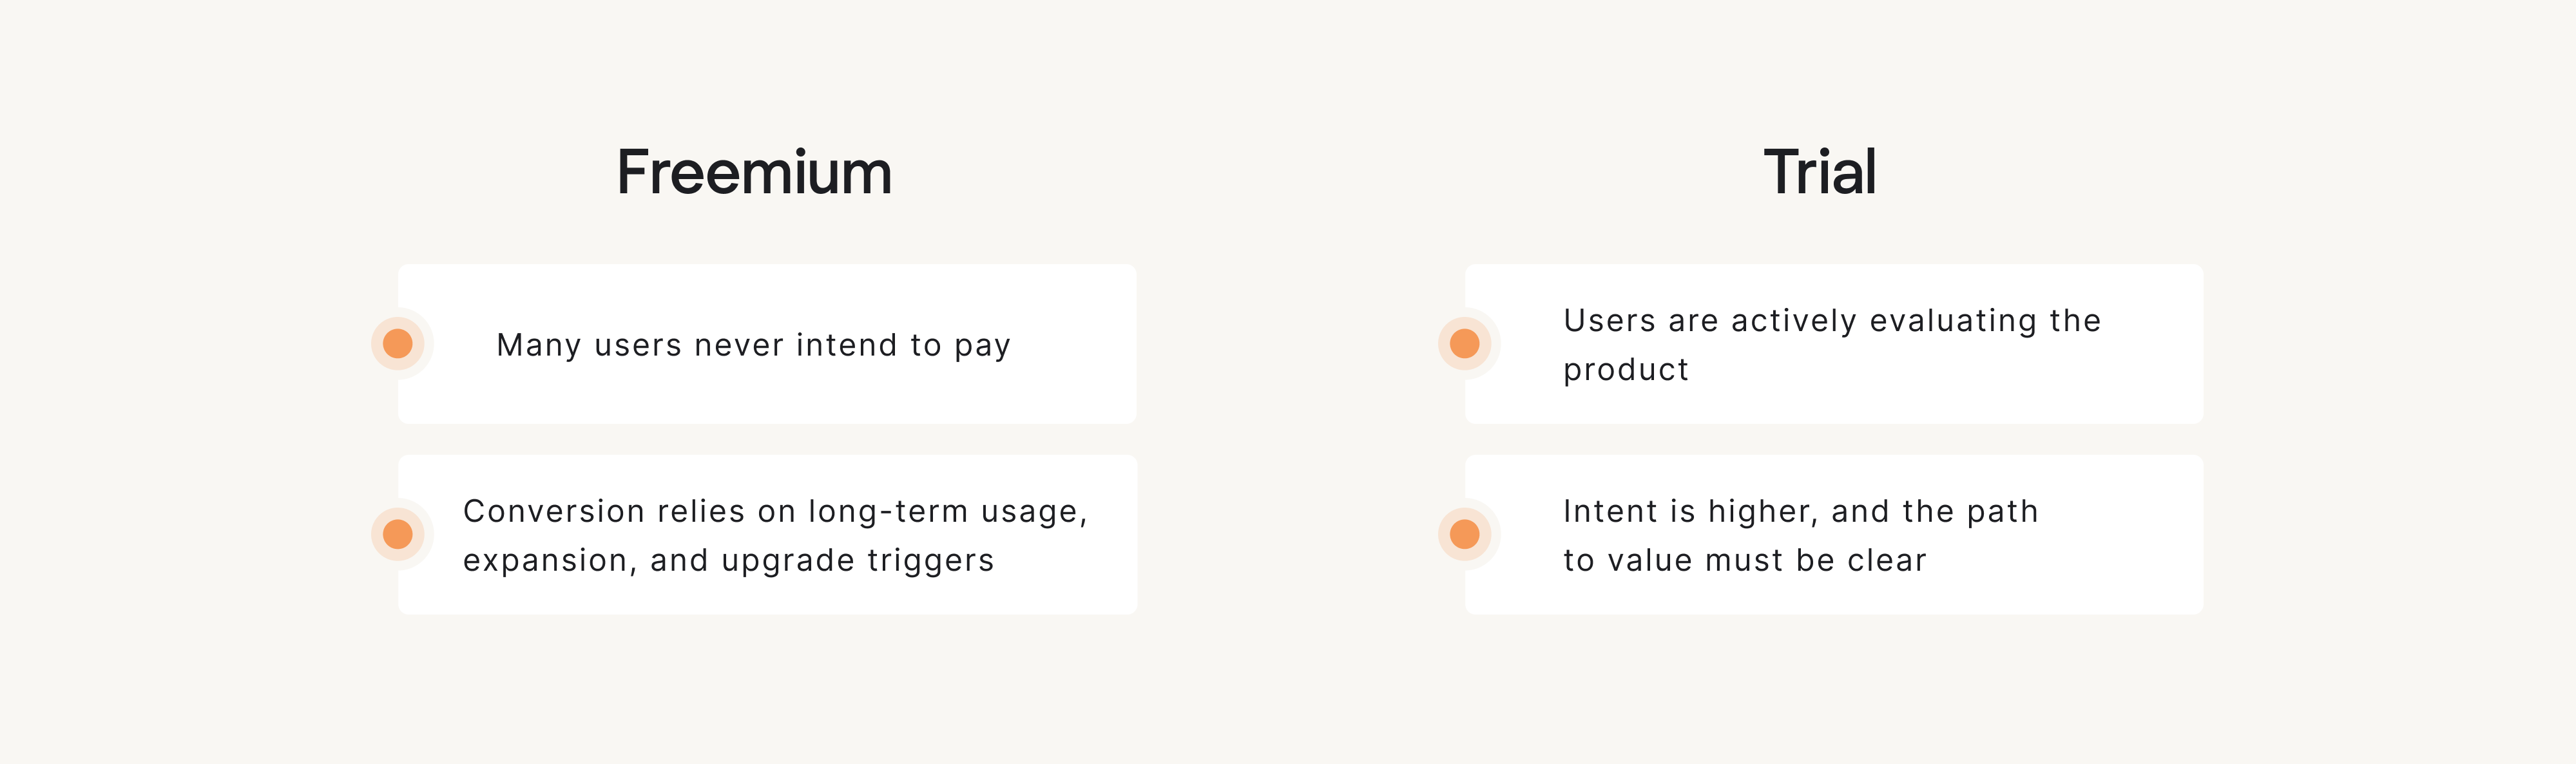
- free plan or trial → upgrade to paid
The transition from free trial usage or a freemium model to paid marks a user’s decision that the product is worth paying for. At this stage, trial users evaluate whether the unique value of the product justifies upgrading.
Strong freemium conversion rates usually depend on reaching the right moment to present more features or expanded functionality.
- demo → customer (sales-led SaaS)
In sales-led funnels, this conversion shows how many prospects move from a demo to a signed contract. It often depends heavily on the sales team, the quality of qualified leads, and the effectiveness of the sales process.
- paid plan → ongoing retention
Retention reflects whether paying customers continue using the product beyond their first billing cycle and whether the experience contributes to long-term customer lifetime value.
So the key takeaway is that SaaS doesn't have a single conversion rate – it has a funnel made up of many funnel conversion rates. And that's actually helpful: once you see which stage is lagging, you can identify areas for improvement and gain insights into how users move through your customer journey.
SaaS conversion rate benchmarks explained
Sure thing everyone loves benchmarks. Still, it never hurts to remind yourself the following – benchmarks are useful only when you know what you're comparing yourself to. So instead of asking whether your numbers are “good” or “bad,” the more productive question is: good for what kind of product, at what stage, and under which conditions?
Anyways, that’s 100% food for thought. And we'll get back to it later in the article, but as for now – here’s the awaited benchmark part.
Below we’ve gathered common SaaS conversion rate benchmarks with quick guidance on when they matter, how to interpret them and some overall context.
Signup conversion rates [top-of-funnel interest]
This conversion rate is most useful when you’re evaluating positioning and customer acquisition through different marketing channels like SEO, referrals, or Google Search Ads.
For most SaaS products, visitor-to-account creation conversion rates tend to fall within these ranges:
What it measures
Out of everyone who lands on your site, how many are willing to take the first step — and create an account to explore your product.
This metric is mainly influenced by:
- Messaging clarity and value proposition (is it instantly clear what you do and who it’s for?)
- Landing page UX (how quickly users understand the offer and find the CTA)
- Perceived pain (how strongly the problem resonates)
- Trust & credibility (social proof, security signals, recognizable logos)
Why the range is 2–10%+
Signup rates can vary a lot from product to product because:
- Most visitors are curious, not ready to buy
- Traffic quality differs dramatically across marketing channels
Key insight: High signup ≠ high revenue
On its own, a high signup rate can look like a win — but be careful. You can get 10–15% signup conversion and still generate little or no revenue if:
- You attract the wrong ICP
- Users don’t feel enough product value inside
- Monetization strategy is misaligned
Bottom line: Your marketing efforts and positioning affect how well you attract potential customers
Trial-to-paid conversion rates [mid-funnel value realization]
This metric shows how many users who sign up or start a free trial end up becoming paying customers. It’s one of the most meaningful benchmarks — but the “healthy” range depends heavily on your business model.
Typical patterns:
This is also the metric that most directly reflects product strength, how effectively a product achieves SaaS conversion from evaluation to purchase, not top-of-funnel curiosity.
What it measures
Out of users who actually experience the product, how many decide it delivers enough value to be worth paying for.
This is mainly about:
- Product–market fit (does the product solve a real problem for a clear audience?)
- Activation & onboarding completion (do users reach value early enough — e.g., the Habstash onboarding flow case)
- Pricing logic (does pricing match perceived value and usage patterns?)
- Problem strength (is the pain real, frequent, and expensive enough to justify a purchase?)
Why the ranges differ
The conversion range depends on whether you run a freemium or trial model.
Key insight: value must be proven fast
If conversion is low, it often means users aren’t reaching the product’s “aha moment” fast enough, not that pricing is wrong.
Improving this stage usually involves conversion rate optimization that starts with activation. That means designing better onboarding journeys, improving UX clarity, and making the value obvious early on to engage users more effectively.
And basically, this is where good design shines: it helps engage users, guide them toward value, and sometimes re-engage users who lose momentum during onboarding.
For example, in our work with Habstash, a UK-based fintech SaaS helping users plan and optimize savings for home ownership, the client initially suggested a calculator-style signup flow. However, placing large amounts of financial input on a single screen would have created confusion, unnecessary fintech user friction, and a higher risk of early churn. That’s why Eleken recommended a wizard-based onboarding flow, making the user journey smoother and helping users reach the product’s aha moment faster.

Visitor-to-paid conversion rates [end-to-end funnel efficiency]
This metric shows whether your entire go-to-market funnel works end to end — from first visit to paid conversion. It’s the most complete benchmark, but also the easiest one to misread because it compresses multiple funnel stages into a single number.
What it measures
Out of everyone who visited your website, how many ultimately become paying customers.
Here’s how it works: paid customers per visitor = signup rate × paid conversion rate
Example:
- 5% signup rate × 5% paid conversion = 0.25% visitor-to-paid
This number reflects the combined impact of your marketing efforts, sales strategies, and onboarding experience.
Why this benchmark is so low
Visitor-to-paid conversion is often fractions of a percent because it combines two difficult conversions. And any weak link — unclear messaging, poor lead qualification, or attracting unqualified leads — pulls the final number down.
This is also why founders tend to panic over it: the number looks terrible at first glance, and it’s often compared to e-commerce conversion rates — even though SaaS buying decisions typically take more time and involve more evaluation.
That’s why many teams rely on segmentation and data driven decisions to understand which traffic sources produce the best qualified leads.
Key insight
This metric becomes useful only once your funnel is stable and segmented (by channel, intent, and ICP). Before that, it creates more anxiety than clarity.
Churn rate benchmarks [post-conversion reality check]
Conversion benchmarks tell you whether people entered your product. Churn tells you whether they stayed because it was genuinely valuable. That’s why it’s one of the most honest SaaS benchmarks: it reveals signals about customer success and long-term product value to justify the cost over time.
What it measures
Churn rate is the share of paying customers who:
- cancel within a given period, or
- stop using the product enough that renewal becomes unlikely
Churn benchmarks are only meaningful when you define the context — especially timeframe and customer type.
For example, 5% churn annually can be perfectly fine, while 5% churn per month usually signals a serious retention issue.
As a rough reference, here are typical monthly churn targets in B2B SaaS:
In general, SMB churn is higher (tighter budgets, shifting priorities), while enterprise churn is lower (longer contracts, switching costs, more stakeholder buy-in).
What churn actually tells you
Churn isn’t only about “retention.” It reflects:
- whether the product keeps delivering value over time
- how sticky it is in real workflows
- how closely the experience matches the promise
When a user converts and churns quickly, it’s rarely because they randomly changed their mind. More often, it’s a signal that expectations were off — the product was mis-positioned, onboarding didn’t land, or the solution wasn’t the right fit for the job they needed done.
That’s why churn is such a useful benchmark: it shows whether your earlier funnel conversions were deep and real, or just temporary optimism.
Key insight: churn timing matters
Churn percentage is the outcome — but when users leave helps explain why:
- early churn usually points to onboarding gaps, unclear value, or weak product-market fit
- long-term churn often points to pricing pressure, evolving needs, or competitive alternatives
If you want to understand your churn (and not just report it), track retention by cohorts — for example, how many users remain after 3, 6, and 12 months. This makes it obvious whether churn drops after activation or continues steadily over time.
Understanding churn helps teams identify areas where onboarding, positioning, or product capabilities must improve.
And for many SaaS teams, improving retention is an ongoing process tied to product improvements and stronger customer success initiatives.
Why your numbers might differ from benchmarks
The benchmark ranges from above work as good reference points. Though, an average SaaS close rate often becomes misleading because it mixes several different factors. That doesn’t mean benchmarks are useless – it means they’re only a starting point.
For example, factors like customer acquisition, associated acquisition costs, and the length of your sales cycle can dramatically change what “good” looks like.
When you can’t find “segmented benchmarks” (and often you can’t), the best alternative is to use context to interpret your numbers.
So once you understand these factors, you can stop chasing generic benchmarks and focus on improving what actually matters for your business.
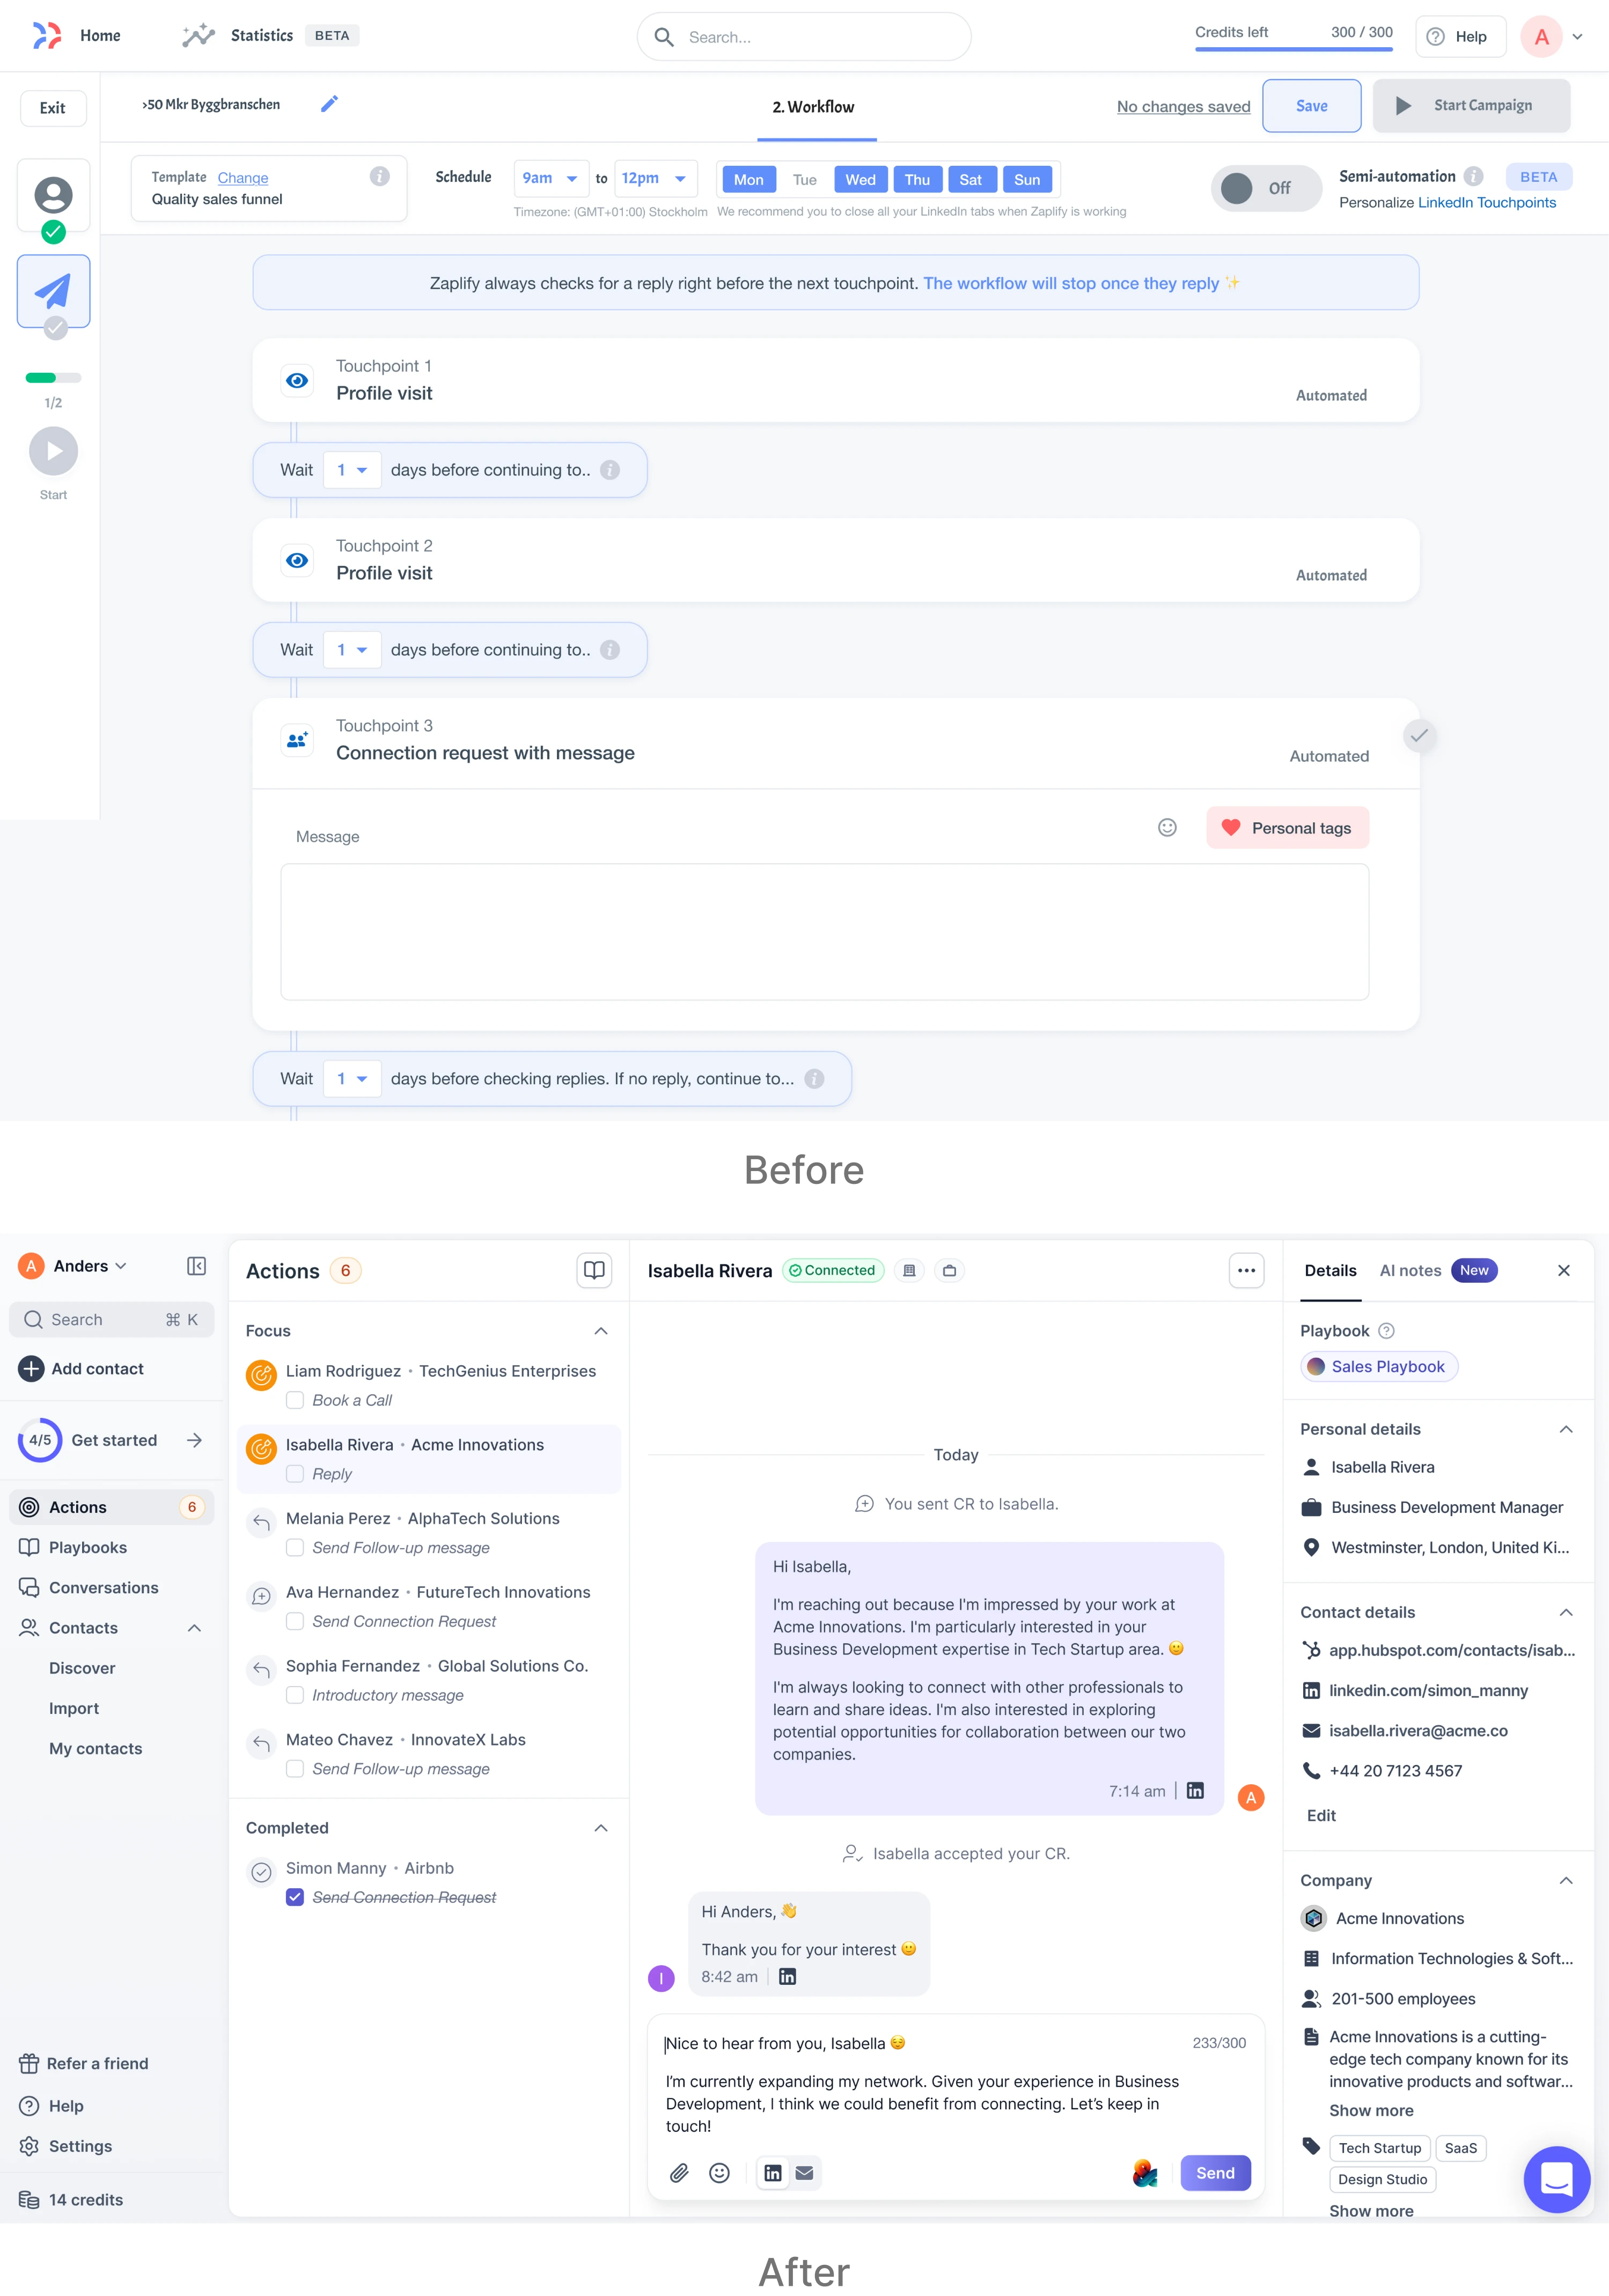
Zaplify, a sales engagement SaaS platform, is a good example of how changing your go-to-market strategy can redefine your benchmark expectations. When the company shifted from a sales-led to a fully product-led model, it could no longer rely on demos and human touchpoints to drive conversions.
As a result, the benchmarks they previously used no longer applied – and their activation rate, stuck around 20–25%, reflected the friction users faced navigating a self-serve experience not yet built for autonomy. To support the shift to product-led growth, Zaplify partnered with Eleken, a SaaS-focused UI/UX design agency, to remaster the self-serve journey – simplifying outreach flows, building trust into onboarding, and adding contextual AI to guide users. This alignment between UX and business model paid off: activation rates nearly doubled to 40%, entirely through self-serve engagement.
Are your conversion rates "bad"? Common patterns explained
If you’re asking whether your SaaS conversion rates are “bad,” you’re already thinking in the wrong direction. A “low” number doesn’t automatically mean your product is failing – it usually means one stage of your funnel is doing more work than another, so you need to identify which and make more informed decisions about.
Here are a few common scenarios SaaS teams run into, and what they typically point to.
Scenario 1: High signup rate, but almost no paid users
What it often means: activation is the real problem.
If lots of people are creating accounts but very few become paying customers, the issue usually isn’t traffic. It’s what happens after signup.
Common causes include:
- users don’t reach value fast enough
- onboarding is unclear or too open-ended
- the product feels complex before it feels useful
- users don’t know what to do next
In short: you’re generating interest, but the product isn’t consistently delivering a “first win.”
Scenario 2: Low signup rate, but strong paid conversion
What it often means: your positioning or traffic is too narrow (or too high-intent).
This pattern can actually be healthy. It often shows that the people who do sign up are highly qualified. But it may also mean you’re not reaching enough of your ICP – or your landing page isn’t communicating value clearly enough to convert more visitors.
This is usually a top-of-funnel clarity problem, not a product problem.
Scenario 3: Conversion rates drop as traffic grows

What it often means: this is normal (and sometimes a good sign).
Many founders panic when conversion rates fall after scaling acquisition. But when you move beyond highly targeted audiences into broader traffic, conversion almost always decreases.
This doesn’t necessarily mean performance is worse – it may simply mean you’re expanding beyond the easiest wins. The question becomes: are you growing qualified traffic, or just more traffic?
Scenario 4: High conversion, but high churn
What it often means: you’re selling the wrong promise.
This is the most misleading scenario because the funnel looks strong on paper. Users sign up, convert, and pay – then leave soon after.
High churn with high conversion usually signals one of two things:
- customers don’t get ongoing value after the initial use case
- expectations are set too high (or incorrectly) before purchase
In other words: the product converts, but it doesn’t retain.
A great example comes from a MyInterview project. The client faced a critical problem: over 90% of candidates dropped off mid-interview. By redesigning the user experience with a focus on clarity and familiar UI patterns (like replacing ambiguous input fields with obvious checkboxes), we helped reduce user confusion and friction. The result was a dramatically improved candidate flow, increasing conversion past the initial signup and into full engagement.

Strategies to improve SaaS conversion rates by funnel stage
Conversion rate benchmarks optimization in SaaS isn’t about “fixing conversion.” It’s about improving the specific stage where users lose momentum — and addressing the drop-off points that prevent users from taking the desired action.
Different funnel stages break for different reasons – and they require different solutions. Below we’ll unpack common issues per stage and what tends to work best to solve them — so your effort goes where it has the highest impact and helps improve SaaS conversions in a sustainable way.
Stage 1: Fixing low signup rates
People don’t avoid signing up because the button is the wrong color. They avoid signing up because they’re not sure the product is for them — or what they’ll get after they enter their email.
This is especially common when a SaaS product communicates features but not outcomes.
So at this stage, your key job isn’t persuasion — it’s clarity.
Problem 1: Visitors don’t understand what the product does in 5–10 seconds
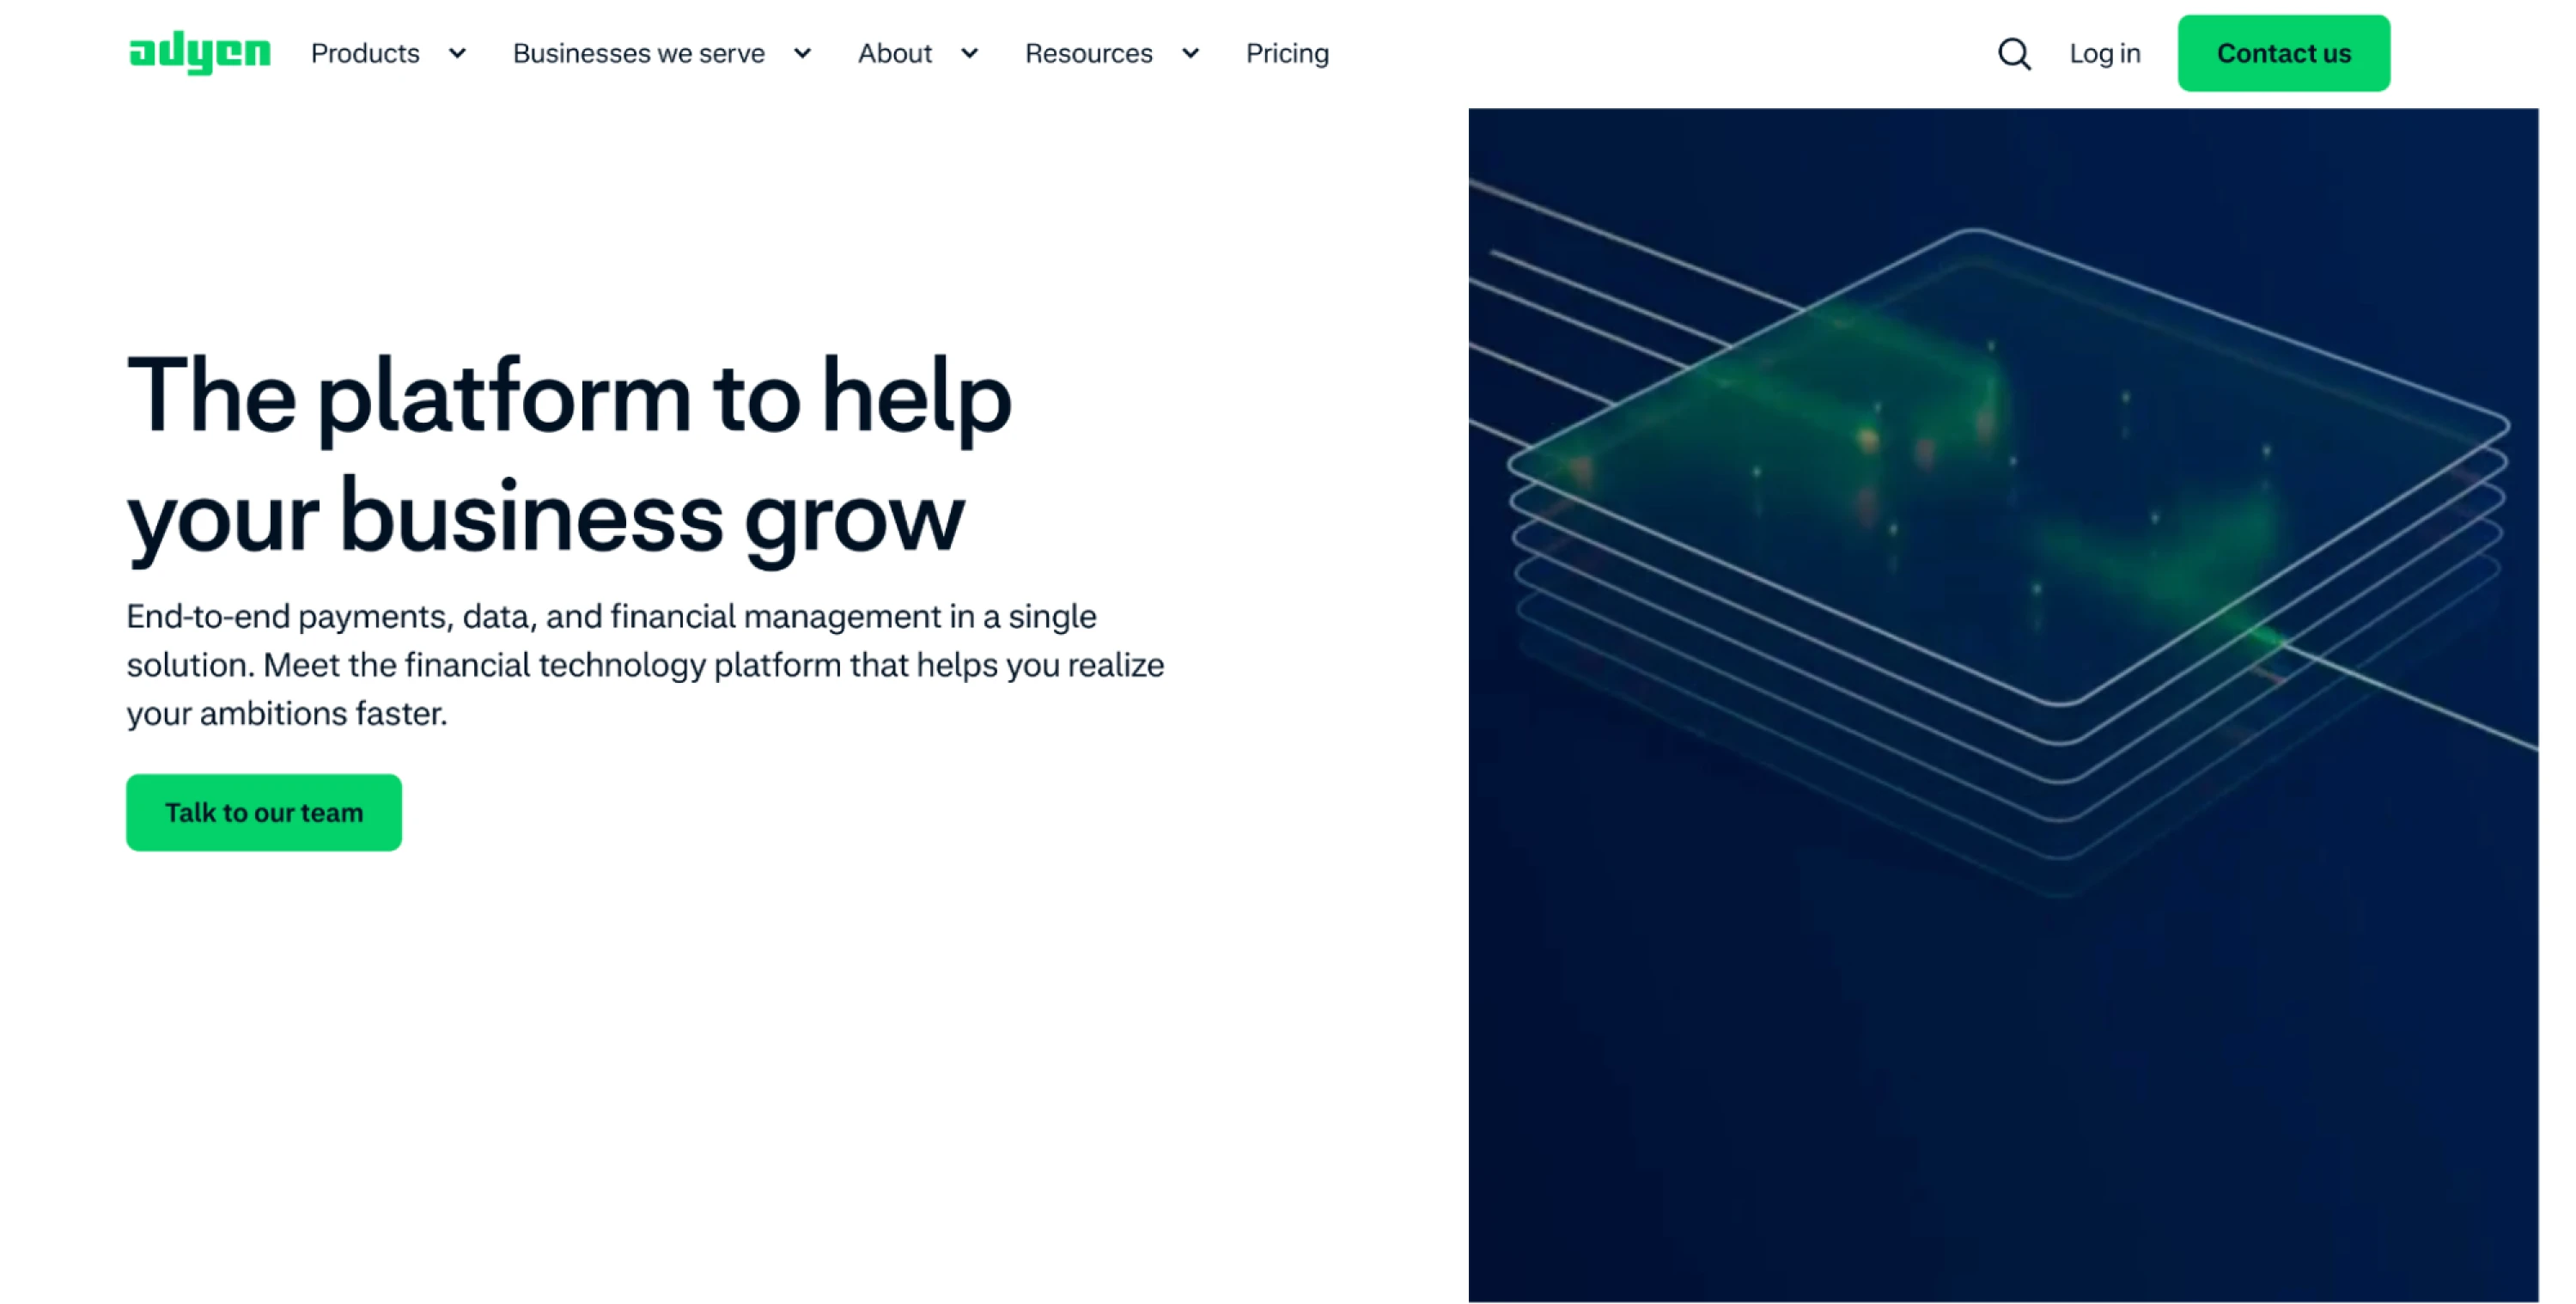
Strategy: Rewrite the hero section around outcomes, not features.
Your hero should answer the basics fast — what this is, who it’s for, and what happens next — so a first-time visitor doesn’t need to work to “get it”:
- what the product helps achieve
- who it’s for
- what happens after signup
If a stranger can’t explain your product after a quick scan, signups — and ultimately conversions — will suffer.
Problem 2: You attract the wrong traffic (high visits, low signup)
Strategy: Align acquisition and messaging.
Traffic that doesn’t match your positioning rarely converts into new customers, even if the page itself looks well designed. This is where strong marketing alignment becomes essential.The goal is to make the promise match what people came for:
- match landing pages to specific intent (ads/search terms)
- remove generic claims (“all-in-one”, “best platform”)
- show real use cases for your ICP
Problem 3: The page feels risky or untrustworthy
Strategy: Add credibility where decisions happen.
Trust signals help visitors feel confident enough to move forward and become part of your customer base. Put reassurance close to the moment of action, not buried elsewhere:
- customer logos / testimonials near the CTA
- short product preview (screens, not abstract visuals)
- clear privacy/security reassurance (“No credit card”, “Cancel anytime”)
Problem 4: The next step feels like effort
Strategy: Reduce friction and cognitive load.
If signing up feels like work, visitors will postpone the decision and your conversions will drop.Make the next step feel lightweight and obvious:
- one primary CTA (avoid competing CTAs)
- shorten the form (email-only when possible)
- make pricing and plan logic clear before signup
Some companies also offer free trials at this stage to reduce perceived risk and encourage exploration.
All in all, chase simplicity in UX design by making the next step obvious and removing anything users must “figure out” before they act.
Stage 2: Fixing activation drop-off
Signup creates potential — activation creates belief. If users don’t experience value early, they won’t convert later, no matter how strong your pricing or sales process is.
Problem 1: Users don’t reach a first “win” fast enough
Strategy: Shorten time-to-value.
Activation improves when users achieve something meaningful quickly. A fast “first win” is often a great example of the product’s real value.
- reduce setup steps
- preload sample data / templates
- use smart defaults
- guide users into a first meaningful action
Problem 2: Onboarding tries to “teach the product” instead of helping users succeed
Strategy: Switch to goal-based onboarding.
Instead of showing everything, ask what the user is here to do and guide them toward that outcome.
- ask 1–2 questions like: “what are you trying to do today?” / “what describes your role?”
- personalize the first flow accordingly
This keeps onboarding relevant and reduces overwhelm. Indeed, it also helps you identify users who match your specific criteria for an ideal customer profile (ICP).
Problem 3: Users get lost after signup
Strategy: Guide the first session.
Users shouldn’t have to guess what the “right” next step is. Help them move forward with a path that leads to value, not a tour of features. You may consider the following:
- checklists that lead to value (not to feature tours)
- contextual tips that appear only when relevant
- progressive disclosure (don’t show everything at once)
Problem 4: Blank states and dead ends kill momentum
Strategy: Make every screen answer “what should I do next — and why?”
Empty dashboards create uncertainty. Replace them with direction, so users always have a clear next action:
- starter tasks
- quick templates
- clear next steps
When users continuously see progress, they are more likely to stay active and reduce churn later in the lifecycle.
Stage 3: Fixing low free-to-paid conversion
Paid conversion isn’t just about pricing. It’s about timing, perceived value, and upgrade moments. If users reach value but don’t upgrade, the usual reason is simple: they don’t feel a reason to pay right now.
Problem 1: The paywall appears too early (before value)
Strategy: Move monetization closer to the “aha” moment.
Paywalls work best after users have something worth keeping, scaling, or sharing — not before they’ve seen the outcome. Therefore, consider the following:
- placing the upgrade moment after a meaningful result
- monetizing what helps them repeat or expand that result
Problem 2: Users get value but don’t feel urgency to pay
Strategy: Trigger upgrades at moments of intent.
Upgrades convert when they appear at the exact moment users want to do more. Tie prompts to behavior that signals readiness. It could be:
- hitting limits
- exporting
- inviting teammates
- trying automation or integrations
- repeating an action that can be scaled
Problem 3: Pricing feels like paying for steps, not outcomes
Strategy: Gate outcomes, not effort.
Users don’t want to pay for “more clicks.” They accept paying for results that matter to their work and goals. It could be something of the following or combinations:
- collaboration
- automation
- reporting depth
- integrations
- scaling usage
Problem 4: Upgrade options feel vague
Strategy: Make the “missing value” visible.
If the upgrade is abstract, it’s easy to postpone. Show users what changes after they pay in practical, outcome-based terms:
- “Save 5 hours/week with automation”
- “Unlock team workflows”
- “Export reports for stakeholders”
Problem 5: Users hesitate and forget
Strategy: Combine in-app prompts with follow-up emails.
In-app captures intent in the moment, and email brings users back when they’re away. Together they usually outperform either channel alone. Try out the following:
- use in-app prompts during high-intent actions
- follow up by email with a clear reminder + next step
Stage 4: Fixing low demo close rates (sales-led SaaS)
In sales-led SaaS, conversion doesn’t happen inside the UI alone. It happens in the sales process. A healthy average sales conversion rate is often 10–20%, depending on lead quality and motion.
Problem 1: Demo conversion drops as you scale
Strategy: Tighten qualification (not more demos).
Scaling breaks conversion when the pipeline fills with weak-fit leads. Protect close rates by filtering earlier and focusing on readiness:
- add pre-demo questions
- segment by ICP
- filter out low-intent leads earlier
Problem 2: Inbound and outbound demos are mixed together
Strategy: Separate reporting by channel.
Inbound demos convert higher by nature, while outbound often requires education. Mixing them hides what’s actually working. Instead, try out the following:
- track inbound and outbound separately
- tailor messaging + enablement to each motion
Problem 3: Sales spends time on “maybe” leads
Strategy: Optimize for demo quality, not demo volume.
Fewer, better-fit demos usually beat a higher quantity of weak ones. Clarity on use case and ROI early improves close rates. Therefore focus on:
- prioritizing leads with a clear use case
- proving ROI faster and more concretely
- reducing time spent on low-signal opportunities
Ultimately, most conversion gains come from fixing the weakest stage. Identify where users lose momentum, focus your effort there, and remove friction step by step. Over time, you’ll see the numbers follow.
Strong SaaS conversion rates are built, not chased
Healthy SaaS conversion rates aren’t something you “hit” by chasing benchmarks – they’re the outcome of good product decisions. Clarity in messaging, a frictionless UX, thoughtful onboarding, and realistic expectation setting all shape whether users move forward or drop off.
Benchmarks can be useful, but only as reference points. They help you orient yourself, not define success.
So the real question about your conversion rate SaaS metrics isn't: “Is my level good enough?”
It’s: “Do users reach value – and do they feel a clear reason to pay?”
When those two things hold true, conversion rates tend to improve naturally – and sustainably.
If you want support with that, you can always turn to Eleken — we help SaaS teams build clearer paths to value with UX and onboarding.